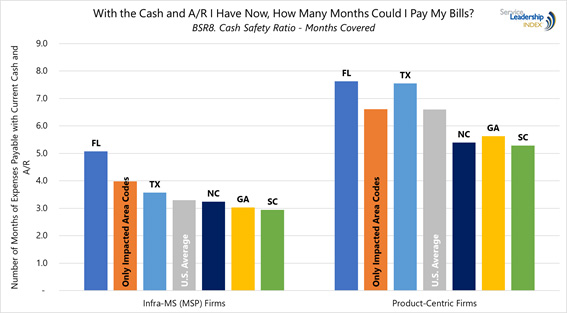
BSR8 is probably the more important ratio – again, cash is king.
Thankfully, whether we look at Managed Service-Centric firms or Product-Centric firms, those in Florida and Texas, where the impact was the harshest for the most people, the Cash Safety Ratio is higher than the U.S average. The same is true when considering only the impacted area codes of Texas (and all of the four other states).
That said, unfortunately, the BSR8 ratios for Georgia, South Carolina and North Carolina, are lower than the U.S. average and considerably lower than Florida and Texas.
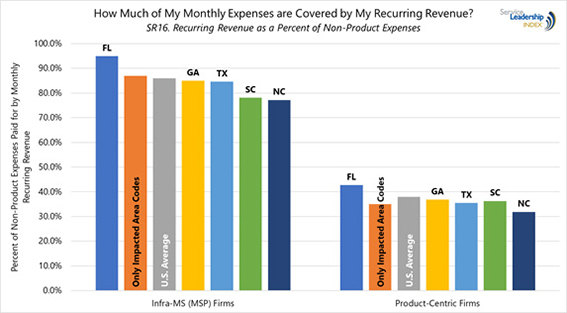
The picture is much the same when looking at SR16 – Recurring Revenue Coverage of Non-Product Expenses:
- Florida MSPs score above the U.S average with over 90% of their non-product expenses covered by their recurring Revenue.
- The impacted area codes of Texas (not shown separately on the charts) also scored high, with 89% versus 82% for the non-impacted area codes of Texas.
- These compare to 86% for the U.S average MSP.
However, when looking at Product-Centric firms, only those in Florida have a Cash Safety Ratio higher than the U.S average. Not even the Product-Centric firms in the impacted area codes of Texas are above the U.S. average.
How Safe Are These Ratios, in Reality, and How Should We Cope?
We can surmise from this analysis that the average Solution Provider in the impacted regions is reasonably safe in terms of cash and A/R, and in terms of the degree to which their expenses are covered by their recurring Revenue.
But, that is only true if the A/R is collectable and if the amount of recurring Revenue to be invoiced, doesn’t drop. Based on past experience, here is what we expect for the Immediate future, for those firms in the Infra-MS (MSP) and Product-Centric PBMs.
Immediate Coping Factors for Infra-MS (MSPs)
|
Factor
|
Immediate
(1 month)
|
Near-Term
(3 Months)
|
Coping Tactics
|
|
A/R Collection
|
Widespread slow pays.
|
5% to 15% of A/R will end up as bad debt.
|
- As soon as practical, reach out and establish gentle but firm payment dates for the next 1-3 payments.
- Establish a rating mechanism for monitoring all accounts.1
- Offer leasing for recovery product and projects but don’t fund it yourself.
|
|
Recurring Revenue Accounts
|
1% to 5% immediate contract cancellations.
|
5% to 20% of total MRR reduced due to requests for reduced contract terms2 or client going out of business.
|
- Try to get agreement in advance that SLA/scope reductions are temporary.
- Remind the decision-maker that they will still have to do IT somehow, that IT enables them to serve customers, pay employees, invoice, collect, etc.
|
|
Cancelled Contracts Due to Preference or Going Out of Business
|
See row above.
|
See row above.
|
- Remember you need some form of off-boarding project. Not only to keep the customer safe, but because you need a signature saying you have off-boarded responsibly as of X date.
|
|
Product and Project Revenue
|
Slight increase in product Revenue. 10% to 30% increase in project Revenue.
|
20% to 40% increase in product Revenue. Continued 10% to 30% increase in project Revenue.
|
- Re-balance MS and field team workloads, towards the field.
- Call in your known good contractors.
- Look for good new hire (or at least new contractor) candidates among local clients and Solution Providers who are, unfortunately, going out of business.
- Now is the time to leverage your documented processes to spread work out among more people.
|
|
Time and Materials Support Revenue
|
Increase of 5% to 10%.
|
Increase of 10% to 20% as more of existing MRR accounts switch to T&M, and as more “orphaned” accounts show up.
|
- For existing MRR accounts wanting to switch to T&M, try to negotiate it as temporary.
- For existing T&M accounts who face large temporary increases, try to convert them to MS.
- For orphaned accounts, make a short-term T&M arrangement contingent on converting to MS once the emergency need is over.
|
|
New Business
|
Mostly product, T&M support and projects.
|
5% to 10% MRR increase opportunity by securing “orphaned” MS accounts from other MSPs who are still struggling or have gone out of business.
|
- See under “Time and Materials Support” immediately above.
|
In emergencies and economic downturns, MSPs generally experience an MRR decline of between 5% and 20%, for all the reasons noted above. That said, some percentage of MSPs go out of business or weaken to the point that they cannot serve MRR customers, and those “orphan” customers seek out new MSPs with whom to contract.
Similarly, as customers realize that on-premise systems (likely) had the longest downtime, we will see added momentum to the flight to the cloud. As top-performing MSPs know, this means an increase in Managed Services Revenue as the customer goes to the cloud.
If you were in the business in 2001, you may recall that, in the SMB space, the modern backup and recovery era was struggling to get started. Many SMB Solution Providers had developed BU/DR offerings that were more reliable and effective than the then-current plague of tape backup systems, but most could not convince clients to try them
Sadly, the region in which the initial adoption first spiked was the New York / New Jersey / Connecticut area in the months after the September 11 attacks. This momentum spread to the rest of the country over the course of the next few years. This BU/DR effect – and a less pronounced but corollary effect to be more likely to buy Managed Services and, more recently, cloud – has followed each major disaster (thankfully almost all naturally occurring) since then.
Immediate Coping Factors for Product-Centric Firms
In disaster situations, many – but not all – of the patterns for Product-Centric firms are the same as for MSPs. There are significant differences; we cite just the differences or points of emphasis in the table below. Hence, we suggest Product-Centric firms read the above table for MSPs, as well.
|
Factor
|
Immediate
(1 month)
|
Near-Term
(3 Months)
|
Coping Tactics
|
|
A/R Collection
|
Same as above.
|
5% to 10% of A/R will end up as bad debt: higher on services, lower on product.
|
- Underscore: Offer leasing for recovery product and projects but don’t fund it yourself.
|
|
Recurring Revenue Accounts
|
Same as above.
|
Same as above.
|
|
|
Cancelled Contracts Due to Preference or Going Out of Business
|
Same as above for MRR. 5% to 10% for product/project contracts.
|
Same as above for MRR. 5% to 10% for product/project contracts.
|
- Underscore: Offer leasing for recovery product and projects but don’t fund it yourself.
|
|
Product and Project Revenue
|
Decrease in product and project Revenue of 5% to 10%. This is because so much of your Revenue is from product/project.
|
Stable to down 20%. Difficult to predict, but some cancellations or delayed orders will be offset by emergency/recovery product and project orders.
|
- Same as above.
- Apply Solution Architects to billable work, even if low-skilled tasks.
|
|
Time and Materials Support
|
Increase of 10% to 15%.
|
Same as above.
|
|
|
New Business
|
Same as above.
|
Same as above.
|
|
In emergencies and economic downturns, Product-Centric firms, unfortunately, have a harder time surviving than do MSPs. In the downturns of 2001-03 and again in 2008-09, the failure rate of Product-Centric firms was about 20% versus about 10% for MSPs. Meanwhile, those who survived experienced Revenue drops of 20% to 50%, while MSPs saw Revenue drops on average of about 10% to 20%.
We are encouraged that the BSR8 ratio is higher for the average Product-Centric firm than for the average MSP; they need the extra safety.
What About Merging? What About Valuations?
Some Solution Providers who are experiencing undeserved stress from these massive disasters, may consider merging or selling to stronger firms in the region, or to firms outside the region who have expressed or start to express interest.
For some, this may be a path preferable to either going out of business or experiencing a prolonged recovery period without additional resources. This is generally the case after such geographic tragedies. The increase in mergers and acquisitions typically starts soon after the disaster and goes on for a period of 12-18 months.
Obviously, feeling you have no alternative but to merge or sell, is not a good feeling. On the other hand, it is certainly good to have the option if needed, and may be the most beneficial path for the owners, the employees, the vendor partners and the customers.
The ins-and-outs of mergers and acquisitions are too complex to undertake a full discussion here. However, we can provide some key suggestions for investigating this path in an urgent situation.
Valuations and Deal Structures in Distressed Situations
The typical distressed situation is that the economy (local and broader) is in reasonable shape, but the specific Solution Provider has not managed to create a successful path. In the case of disasters, this may or may not be true, but the distress is compounded greatly by the softness of customer behavior we have discussed above.
This – and the often-urgent timelines to execute the merger or acquisition – tend to push values down. The seller may also want more cash up front, and this, too, tends to push overall values down.
The seller is generally not in the optimal position to negotiate, because current and near-term business results are likely to be sub-optimal. Nevertheless, the seller is usually not inclined to take deals he or she perceives as one-sided; nor do such deals usually work out for the buyer, long term.
The parties may want to consider a longer than average earn out (say, 2-3 years versus the usual one year). The earn out might be based on Revenue from existing accounts and those companies on the seller’s prospect list that were not on the buyer’s prospect list. This gives the seller the maximum upside while still managing risk for the buyer.
At the same time, it leaves most of the profit factors in the control of the buyer. This is usually good. The buyer usually doesn’t want to give the seller the level of responsibility in the post-merged company, that the seller would logically ask for if more of the earn out was based less on Revenue and more on Gross Margin or bottom line profit.
Keep in mind the value of doing a good job of mutual qualification, even under shortened timeframes.
To ensure the highest likelihood of customers coming over successfully for the long term, before the deal is framed up:
- Take five of the sellers typical (not largest or smallest) customers, and price them on the buyer’s pricing model, (no customer names needed). Then take five of the buyers typical customers and price them on the seller’s pricing model.
- If the seller’s customers are priced higher, there is a good chance they will come over and be profitable for the buyer. The buyer may even be able to raise prices more easily on their own customers.
- If the seller’s customers are priced lower, there is a materially lower chance they will come over to the buyer’s company, be profitable, and stay. And, the buyer may find his or her staff questioning why the buyer’s pricing is “so high”.
In the latter case, it would be wise to not do the deal.
Similarly, compare the Target Customer Profile (size range) of the buyer’s and seller’s core customers. If they are materially different, don’t do the deal. This is true even if the buyer or seller thinks adding a new Target Customer Profile is a good strategy. Even in the best of times, it’s not.
Lastly, within the bounds of common courtesy, buyer and seller should try to avoid the temptation to treat each other with kid gloves during the negotiation. Successful working relationships are possible when the two parties disagree, work it out, and are still able to come to work the next morning and feel ok about the result.
The best time to determine whether that’s likely to be true in the future, is now, during the deal negotiation. Be frank, be direct and communicate authentically, now, as you negotiate the deal. Find out what the other person is like.
In Conclusion
Our hearts and minds are with the Solution Providers in the impacted regions, and their families. The scale of these disasters is mind-boggling, so the best strategy is probably to focus on your immediate needs, in your immediate area, and take it step-by-step. Celebrate the small victories and look up, when you can.
If we can be of any assistance, please, as always, feel free to reach out to us at paul@service-leadership.com or brian@service-leadership.com.