The Future of Best-in-Class MSPs

Service Leadership Index® The Future of Best-In-Class MSPs

A large-scale survey of Managed Service Provider (MSP) CEOs worldwide on their perspectives of the future of their business model was recently conducted by Service Leadership, Inc. This survey is available to purchase for US$1,495.00 and can be downloaded immediately.

Other than garnering a response from hundreds of MSPs worldwide, the survey has two unique aspects. All participants subscribe to our Service Leadership Index quarterly financial benchmark service. Thus:

  • We have 85 financial performance metrics and six Operational Maturity Level factors by which we can cut the survey data, to see how the opinions of the Top performing (Best-in-Class) MSPs with the most operationally mature management teams differ from those of the lower-performing MSPs with the less operationally mature management teams.
  • We objectively determined who was actually an MSP using our Predominant Business Model algorithm1, based on our established revenue mix tipping points, rather than the more common method of simply asking the participant if they felt they were an MSP. This means all the participants are in fact materially in the MSP business, not just aspiring to be.

We also sliced the data by Target Customer Profile - that is, size range of customers pursued – by vertical markets, and by importance of primary vendors. The bulk of the participants focus on the 26-100 user space. Today's overview looks at the opinions of these SMB-focused participants.

Question 1: Bullish or Bearish About the Future of Managed Services?

The first of the 39 topics was, "Overall, I am ____ about the future of Managed Services as a business." Ignoring profitability or operational maturity, the responses were somewhat less bullish than we expected:

  • 63.5% said they were bullish, while 23.8% stated they were neutral, and 12.7% said they were bearish.

When these results are sliced by profitability and by operational maturity, additional insights emerge.

Within the MSP business model, we designate as Best-in-Class (BIC) financial performance, those who are in the Top Quartile of EBITDA2 % after fair market owner compensation is taken from the income statement. Through Q3-2016, that figure is 18.1% EBITDA, regardless of geography, customer size, vertical market, vendors chosen, or MSP size. Median during the same time period is 7.8% EBITDA, and Bottom Quartile is negative 1.6%. That is, in any given market, one-quarter of MSPs are making 18.1% or more, and one quarter are losing money. The difference is the operational maturity of the management team.

The chart below shows how bullish or bearish about the MSP business those participants were in each of the profitability categories above:

Figure 1: The Future of Best-in-Class MSPs Report - Question 1 Response by Profitability

The lower-performing MSPs (B 1/4) were somewhat more likely to be bullish, and notably less likely to be bearish, than the higher-performing (Best-in-Class) MSPs. Those who are performing better, felt less bullish about the future of the business, though even then slightly less than 1 in 5 chose "bearish” as their answer.

We also segmented the response by the Operational Maturity Level (OML) of the participants. We determine their OML by asking them in our benchmarking service, either six or 39 specific questions about how they make certain key decisions and execute certain key activities in their businesses, and compare their answers to those in the Top and Bottom Quartiles of financial performance. To the degree they answer as do the Top performers, we give them a higher score on the 1-to-5 OML scale. To the degree they answer as do the lower financial performers, we give them a lower OML score.

There is thus a close correlation between OML score and financial performance. OML 1 and 2 companies struggle for consistent profitability, growth and service quality, OML 3 companies have moderate success at more consistently delivering these results, and OML 4 and 5 companies are most often higher performers in all three areas.

When we look at their bullishness/bearishness segmented by these OML score tranches, in this case we see different results than when sliced by profit performance.

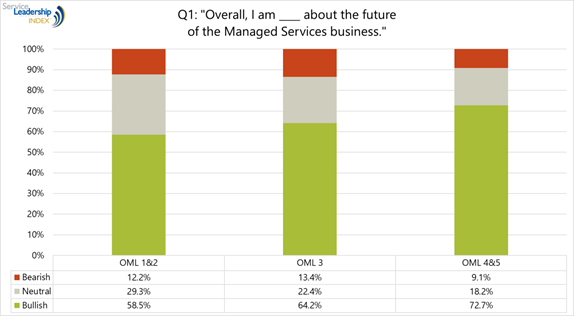
Figure 2: The Future of Best-in-Class MSPs Report - Question 1 Response by OML

Clearly, those at OML 4 and 5, are more bullish about the business than those who use the management methods of the lower financial performers. The two charts tell us the higher profitability MSPs are more aware of the difficulty of attaining and maintaining Top Quartile profitability, but those who are more operationally mature feel markedly more confident of navigating those challenges in the future. The lower performing MSPs, on the other hand, are perhaps more "irrationally exuberant” about the future, but those at lower levels of operational maturity are less optimistic about their ability to succeed in the future.

Q2: I _____ Start (or Buy) a Managed Services Business Again.

When asked the question, "If I had the opportunity, I (would, would not, would maybe) start (or buy) a Managed Services business again,” the participants answered:

  • 73.0% said they would, 19.8% said they might, and 7.1% said they would not.

This tells that a large proportion of these highly entrepreneurial decision-makers feel that the MSP business is the best place to invest their time and energy to produce a meaningful return. Fewer than 1 in 10 thought they would not do so again

Figure 3: The Future of Best-in-Class MSPs Report - Question 2 Response by Profitability

As their profit performance improves, significantly fewer say they would not build a Managed Service business again; among the Best-in-Class, none said they would categorically not do it again and fully 91.3% said they would. Understandably, nearly one-fifth of the CEOs of the Bottom Quartile firms said they would not repeat their efforts in the MSP business. Yet still 75% of them said they would. The Median performers were, again understandably, the most likely of the three performance groups to be on the fence, with the majority (67.8%) still saying they would build another MSP business but one-quarter (24.1%) saying they might or might not.

Slicing the data by Operational Maturity Level, we get an equally clear message:

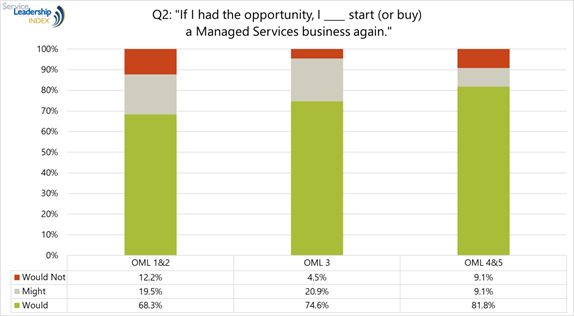
Figure 4: The Future of Best-in-Class MSPs Report - Question 2 Response by OML

Over 80% of the more operationally mature MSPs would invest again in an MSP business, while less than 10% would not. Of those struggling with operational basics (the OML 1 and 2 firms), slightly less than 70% said they would, and nearly one-in-five said they would not. The same proportion of CEOs of OML 3 firms said they would not, but nearly three-quarters said they would.

Q4 and Q5: Vendors' Efforts to Disintermediate the Channel

Question 3 in the survey focused on cloud, but in today's overview, we'll now skip to Questions 4 and 5, which sought to understand the MSPs' views of the future of vendors' efforts to disintermediate the channel, and how likely the vendors would be to succeed.

Q4 was: "Vendors' efforts to disintermediate the channel will ____ over the next 3-5 years.” The charts below show how the participants responded, first segmented by the MSP's profitability and then by their OML.

Few MSP CEOs feel that vendors in general will reduce their efforts to disintermediate the channel, and a clear majority in each profitability group feel that vendors will increase their efforts. Generally, the more profitable the MSP, the more likely they are to feel disintermediation efforts will increase.

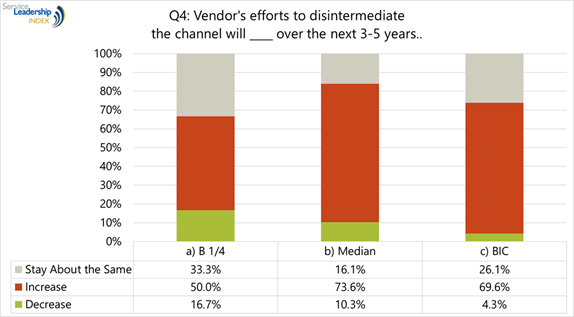
Figure 5: The Future of Best-in-Class MSPs Report - Question 4 Response by Profitability

Interestingly, the emphasis switches when segmented by Operational Maturity Level:

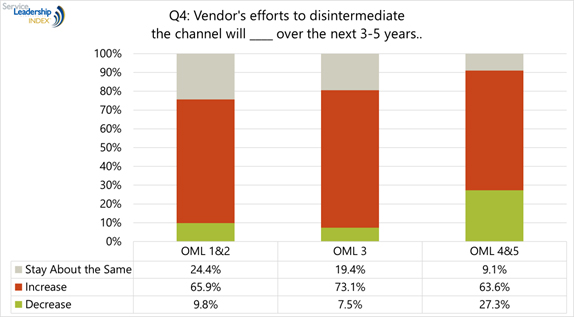
Figure 6: The Future of Best-in-Class MSPs Report - Question 4 Response by OML

The higher OML MSPs are less likely to feel that disintermediation will increase, and most likely to think it will decrease.

When segmented purely by operational sophistication (in the areas of strategy, financial management, sales management, service management and incentive compensation design), the greater awareness of the high OML about the operational challenges of being successful in the business causes them to discount the likelihood that vendors will try to eliminate them and sell directly to customers.

Q5 then sought their opinions of whether vendors would succeed at disintermediating the channel.

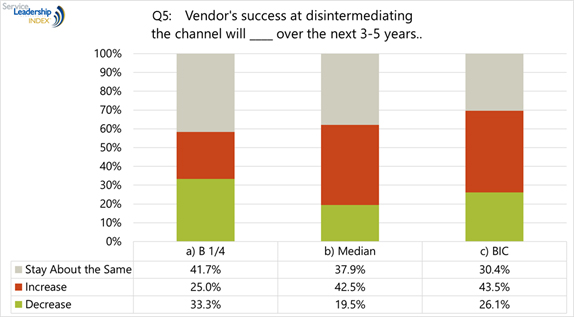
Figure 7: The Future of Best-in-Class MSPs Report - Question 5 Response by Profitability

Here, the Top (Best-in-Class) performers were more likely to have the opinion that vendors' success would increase, while the lower performers were more likely to say vendors' success at disintermediation would decrease. The largest proportion of lower-performing MSPs thought the vendors' success at disintermediation would be about the same as it is today, while the largest proportions of the Median and Top Quartile performers thought that vendors' success would increase. The more profitable the MSP, the more likely they were to think that vendors would succeed at gaining a chunk of their business.

When sliced by OML, however, we see the same divergence in opinion as we did about whether vendors would increasingly try to disintermediate:

Figure 8: The Future of Best-in-Class MSPs Report - Question 5 Response by OML

The more operationally mature MSPs were most likely to feel that vendors would have less success disintermediating in the future than they do today, and least likely to feel the vendors would have more success. While the higher OML MSPs on average have about triple the EBITDA % performance financially than do the OML 3 MSPs, when the responses are segmented purely by OML, the opinions of the operational challenges faced by the vendors become more stark.

Q8: Use of "Master MSPs”

Questions 6 and 7 focus on the Internet of Things (IoT), but in today's overview we'll skip to Question 8.

We are increasingly interested in whether MSP decision-makers are seeking to accelerate their operational maturity by outsourcing an increasing portion of their operations to "back end” providers such as Master MSPs.

High performing MSPs score high in operational maturity across five areas of their business: strategy, financial management, sales and marketing management, service management and incentive compensation structure. Within these five functional areas, we track 39 distinct operational maturity "Traits” as we call them. Getting to high OML in all 39 is generally not a quick or simple task.

Logically, if growth in profits and stock value is the goal, at least some MSP decision-makers might choose to effectively shift the need to grow in operational maturity in some areas of their business, to someone else. Some MSPs attempt to outsource a smaller or larger part of their marketing and sales process. Some, instead of or in addition to this, attempt to outsource a smaller or larger part of their service delivery, most often their Networks Operations Center (NOC) or their Service Desk (SD) or both.

Traditionally, the use of a Master MSP for NOC and SD services has been positioned by the Master MSPs as a way for the would-be Managed Services operator to enter the MSP business in less time, with less up-front investment and less risk. This is more often than not, the actual outcome; the would-be MSP can focus their time and energy on "only” becoming more operationally mature in strategy, financial management, sales and marketing and incentive compensation, while the Master MSP eliminates much of the need to become more operationally mature right away in service delivery management.

However, we're now well past the 10th year or so of widespread efforts of Solutions Providers to become MSPs. Given more existing MSPs have experience in the business, is use of Master MSPs more common among the higher or the lower performers? Are higher or lower performers more or less likely to consider using a Master MSP in the future? What of those who are higher or lower in OML?

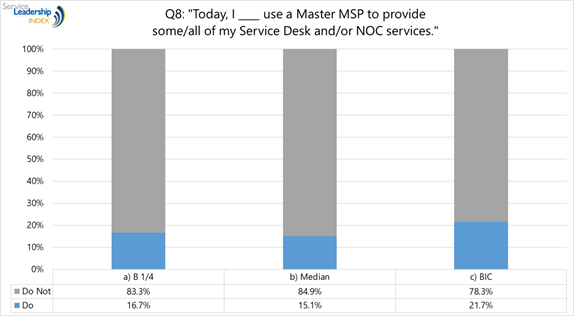
Figure 9: The Future of Best-in-Class MSPs Report - Question 8 Response by Profitability

The chart above shows that the great majority of MSPs do not use a Master MSP: about 80% regardless of financial performance. However, of those who do, they are somewhat more likely to be in the Top Quartile of financial performance: more than one-fifth of the high performers use a Master MSP for some or all of their remote services. This flies in the face of the commonly held opinion that, "If I outsource my NOC and Service Desk to a Master MSP, I'll be less profitable.” In the full report, we delve into the reasons for this somewhat higher use of Master MSPs among a greater proportion of the MSPs in the Top Quartile of profitability.

Likewise, the higher OML MSPs – as well as the lower OML ones – are more likely to use a Master MSP for some or all of their services, than are those at OML 3.

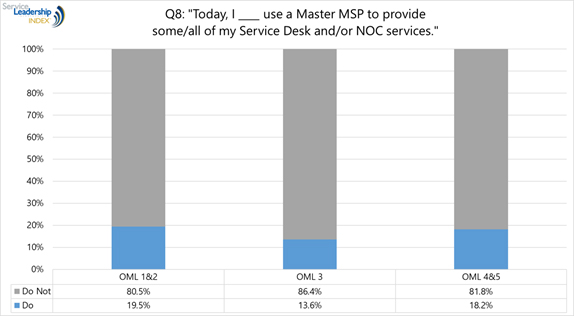
Figure 10: The Future of Best-in-Class MSPs Report - Question 8 Response by OML

Those most challenged by the 360-degree management of the MSP business, and those who have mastered it most, are most likely to use a Master MSP. Again, however, nearly 80% of MSPs in all three OML groups, do not use a Master MSP.

The question then becomes, are these MSPs more or less likely to do so in the future?

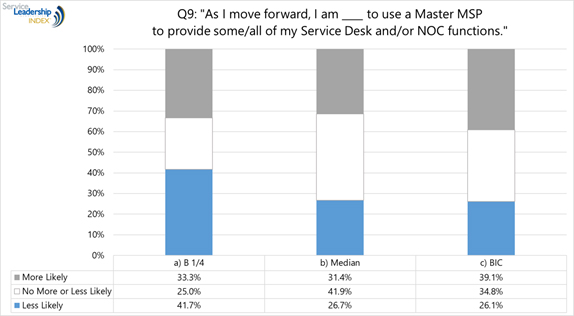
Figure 11: The Future of Best-in-Class MSPs Report - Question 9 Response by Profitability

Here we see that the more profitable the MSP is, the more likely they are to say they are more likely to use a Master MSP in the future: 39.1% of them indicated this, making it the most common response among the high profitability firms. Their close-second most common response was, effectively, "no change.”

Conversely, the lowest profitability firms gave as their most common response, that they would be less likely to consider a Master MSP in the future. The Median profitability firms were most likely to say they would not change their opinion of pursuing a Master MSP relationship, but their second most common response was that they would.

MSPs in both the Median and lower profitability groups may want to consider investigating the use of a Master MSP, given the high profit performers higher current use and higher likely future use of Master MSPs.

When we look at the responses by OML, we see a somewhat different pattern:

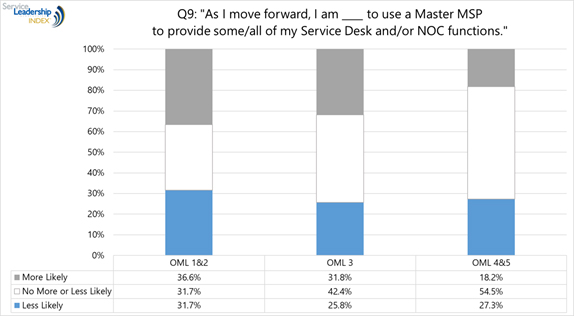
Figure 12: The Future of Best-in-Class MSPs Report - Question 9 Response by OML

Those at low OML are indeed most likely to consider using a Master MSP in the future (36.6%), while the proportion of them who say they would be no more or less likely and less likely were tied at 31.7%. Those already at high OML were markedly less likely to consider using a Master MSP in the future, and their most common response was, effectively, "no change.”

Our fearless prediction is that the higher OML, most of whom – but not all – are in the Top (Best-in-Class) of profitability, will be more likely to consider using a Master MSP in the future. The reason is that, at higher OML, over time, it becomes apparent that more of the differentiated value is in how the customer is won and managed, not in how the service itself is delivered. If my Master MSP is operating at, say, OML 3.8 or higher, and I'm operating at OML 4.1 or higher, the odds are good that I can continue to differentiate and yet still focus more of my effort on taking market share and innovating at the front end, while the Master MSP handles most of the drudge work and the core innovation. And I can do this while shifting a material portion of operating risk to the Master MSP.

Other Aspects Addressed by the Full Report

The full report includes similar analysis – segmented by MSP profitability and OML – on the following topics:

  • How will cloud and IoT impact the MSP business?
  • Which major vendors (Microsoft; Amazon; Google; HP, Inc.; HPE; Dell; and more) will become more important and less important to MSPs in the future?
  • Will MSP pricing and content go up or down in the future, and how?
  • Which areas of the business are currently performing above or below expectations (security, mobility, big data, hardware as a service (HaaS), various forms of cloud, physical security, IoT and others)?
  • Which areas of the business do MSPs expect to invest more or less in, in the next 3-5 years (security, mobility, big data, HaaS, various forms of cloud, physical security, IoT and others)?
  • What are the biggest areas of internal and external risk to their business over the next 3-5 years, perceived by MSPs?
  • How active have you been in buy- and/or sell-side mergers and acquisitions (M&A), and how likely are you to be active in the next few years? What is your opinion of current and future valuation multiples?

All of these data points are analyzed in the full report, by MSP profitability and Operational Maturity Level.

Selected data is also analyzed by country, target customer size, target customer vertical, and the personal age of the MSP executive responding. Custom analysis can be requested by vendors and media.

Order The Future of Best-in-Class MSPs Report for US$1,495.00.

Summary

Overall, we found the participating MSPs to be optimistic about their business and about its future potential and value. Clearly, we are past the early days of heady – if somewhat naïve – optimism and well into the maturing phase of the industry. That said, the maturing phase has been lengthy and is likely to continue for a good deal of time. This is because it's a complex business which has – as we've pointed out – at least 39 important management aspects to master to attain and sustain high financial and service quality performance.

Also, there are tens of thousands of SMB MSPs worldwide and few have yet mastered the methods of surpassing the $20mm revenue range and/or operating multi-location businesses, though the best practices for doing so are known.

We also know, from our quarterly Service Leadership Index® benchmarking, that there is no empirical evidence supporting the much-feared "commoditization of Managed Services” (not possible) or cannibalization of MS by cloud (a misperception of what Managed Services is). This data is backed up by the opinions provided by the participants in this Future of Best-in-Class MSPs report.

Order The Future of Best-in-Class MSPs Report.


1 For more on Predominant Business Models, see: www.service-leadership.com/trial/?tool=findmypbm
2 EBITDA: Earnings Before Interest, Taxes, Depreciation and Amortization, a useful proxy for the business' capability to produce free cash flow.
Follow US Contact Us