Best-in-Class Product/Vendor Selection and Branding
Table of Contents
Turning Around the IT Value Chain; the Tail Wags the Dog
The IT Solution Provider world has grown up being the last mile of the IT hardware and software value chain. Traditionally, vendors do most of the demand generation marketing, and their channel partners – the IT Solution Providers – do what they can to catch their fair share of the demand generated.
Top-performing IT Solution Providers in all 10 Predominant Business Models™ (PBMs™) benefit from turning this model around. Instead of reacting to what the vendors want to market, they create demand for what they want to sell. To the extent that the IT Solution Provider has Service people, and sells its own Services, the importance of turning the model around increases with the proportion of the IT Solution Provider's total Revenue that comes from Services.
More on this, and how to turn the model around, in a moment.
A Lesson from How IT Vendors Succeed
First, though, it's instructive to learn what we can from the vendors' business model:
- Partly to learn why they create demand for what they want to sell, and
- Partly to understand why their efforts to do so, if unchecked by the IT Solution Provider, damage the IT Solution Provider's ability to build a scaled, profitable, high quality Service offering.
The "why" of the vendors' relentless and effective demand generation is straightforward. They want to grow, and to do so profitably. They identify a need in the marketplace and decide to make an investment in designing a new product, building the go-to-market mechanism and, of most relevance to our lesson, preparing a factory and securing the people and raw materials within it, to build the product.
With this investment, failure to reach the planned sales volume has two downside consequences: 1) failure to get the planned Revenue, and 2) increased actual unit cost to produce the smaller number of units than planned:
- If the factory costs the vendor $200,000,000 to prepare and staff, and the planned 100,000 units are sold, then unit cost is (simplistically) $200mm divided by 100,000 or $2,000 each. If the selling price is, say, $4,000, then the vendor attains 50% Gross Margin.
- If instead only 50,000 units are sold, then the effective Cost of Goods Sold (COGS) per unit is $4,000, and a $4,000 selling price means zero Gross Margin. This is both a product and a financial failure.
The drive to sell the full 100,000 units becomes the imperative for the go-to-market activities. This is true for any successful product manufacturing business, including high tech products.
How the Product Volume Imperative Unintentionally Hurts IT Solution Providers
Any IT Solution Provider with a Service team, knows this same cost-versus-volume phenomenon in its own world, well:
- If I as an IT Solution Provider have 10 Service people with an average pay of $100,000 each, my "Service Factory™" has a cost of $1,000,000. If I sell 10,000 hours of billable work (support, Professional Services, Managed Services, etc.) then my unit cost for an hour is $100. If I sell that at $200/hour, I make 50% Gross Margin on my "factory".
- If I only sell 5,000 hours, my unit cost is $200/hour. If I sell that at $200, I make zero Gross Margin and I have a product and a financial failure.
Hence, we introduced the "Service Factory" analogy: IT Solution Providers have a sunk cost against which the right number of units must be sold, at the right price, and – because work hours are a perishable commodity – at the right time, to attain a safely profitable business model.
It's no wonder that the vendors are experts at demand generation: the consequences of not attaining their target volume are material. As a result, they not only create demand, but they have also learned to create significant motivation to sell, in their channel partners through various program inducements.
The challenge created by their skill in generating motivation among their channel partners is that there is a mismatch in business models. To meet their own financial goals and stay relevant in the marketplace, vendors bring out new products more quickly than – and retool their factories – faster than their channel partners can afford to retool their "Service Factories".
Thus, the vendor often sells their 100,000 units, before the channel partner can sell the 10,000 hours they have invested in people, tools, and processes ("factory") to be able to deliver. They have bought Service management and delivery tools designed for a certain product set, built processes and automation around that product set, and often have even hired specific people to provide support for that product set. Then, just as they are approaching their magic 10,000 productive hours against that product set, the vendor changes the product set and aligns inducements to make it difficult in all the ways it can for the channel partner to not retool their Service Factory.
This isn't a deliberate effort on the vendor's part to negatively disrupt the partner's business. It's a well-intentioned desire to have their own business model succeed, combined with a lack of understanding of the practical realities of the IT Solution Provider's service business model.1
The IT Solution Provider's Business Model Matters, But the Strategy is the Same for All
Product-Centric partners (i.e., VARs) are the most tightly bound of the 10 PBMs to this vendor product cycle: per the Service Leadership Index®. On average, 89.4% of a VAR's net income dollars come from vendor rebates. Thus, VARs generally struggle the most to build scalable profitable Service businesses: just as they get their Service Factory set up for their chosen vendor's latest product, that product reaches its goals and the vendor pulls it and demands the VAR sell the next new thing.
Between volume program inducements and the need to ride the vendor's demand generation tail, it takes stout leadership in the Product-Centric firm to resist adopting each year's new products from a given vendor.
In addition, because most Product-Centric firms are not good at generating demand, and because they rely most on "selling" their vendors' brands more than their own, they often decide to carry multiple vendors' products in the same product category, resulting in the need for multiple Service Factories, further fragmenting the volume they can drive through any one Factory.
Combine this with the expense of engineers with the required higher-level certifications, and you can see why the Median profitability of Product-Centric firms is as low as it is.
On the other hand, Services-Centric Solution Providers – we'll use Managed Services Providers (MSPs) as the case in point – on average have only 7.0% of their net income dollars coming from vendor rebates. For the most part, they ignore vendor programs because their financial benefits pale in significance to the Gross Margin generated by a fully utilized Service Factory.
However, Services-Centric Solution Providers often still make the mistake of changing vendor and product vendor selections more often than prudent for maximum leverage on their Service Factory investment. Meaning, for uncompelling reasons, they change product choices too often, and thus have to retool their Service Factories prematurely, and as a result earn low Gross Margin and have more service quality (customer experience) challenges.
Top-performing IT Solution Providers of all PBMs, and more so those who are Services-Centric culminating with MSPs, take a lesson from the vendors, and instead, carefully control not only what products they select, but also the lifetime of their use of that product, and then drive the demand generation for that product in their customer base. They are as good at managing these outcomes in their Service Factories, as the vendors are at managing their analogues in the products factory world.
The Operational Maturity Level™ (OML™)2 Traits associated with this are: Solution and Service Offering Development, Product and Vendor Selection, Driving Technology Standards, and Cross-Selling Effectiveness. These apply equally to both Product-Centric and the Services-Centric Predominant Business Models.
How the Top-Performing IT Solution Providers Choose Their Products and Vendors
Top-performing IT Solution Providers also turn the tables on their vendor partners and induce their chosen vendors to help them drive efficiencies in the Service Factory and elsewhere in their business model.
Here's an example of how.
One high-performing, mid-sized MSP recently commented on how efficient his projects team (his Project "Service Factory" so to speak) was becoming at implementing a new offering (in this case, his advanced cybersecurity).
He had put a campaign together, driven by his vCIOs, to get as many of his 100 Managed Services customers to upgrade within the year, as possible. That campaign proved more effective than even he had targeted, and within the first six months of it, he had sold, and his Project team had delivered, 50 upgrades. He said, the Projects team had become impressively effective and economical at it. Of course, they'd done 50! Imagine how effective and economical they will be when they've done all 100 of his customers!
Herein lies the key. The top-performing IT Solution Providers plan and execute every upgrade this way. This year it's cybersecurity, next year it will be an update to the router standard he rolled out four years ago. The year after it will be updating the backup standard he rolled out three years ago. Year after year, each slice of the technology stack gets upgraded across his base: year after year, maximum efficiency and economy of his Projects team.
Likewise, this slowing-down of new product adoption enables his Managed Services Factory to fully leverage and amortize the investments he has made in their tooling, people and processes, and so he gets maximum utilization and effectiveness (profitability and customer experience) out of that factory as well.
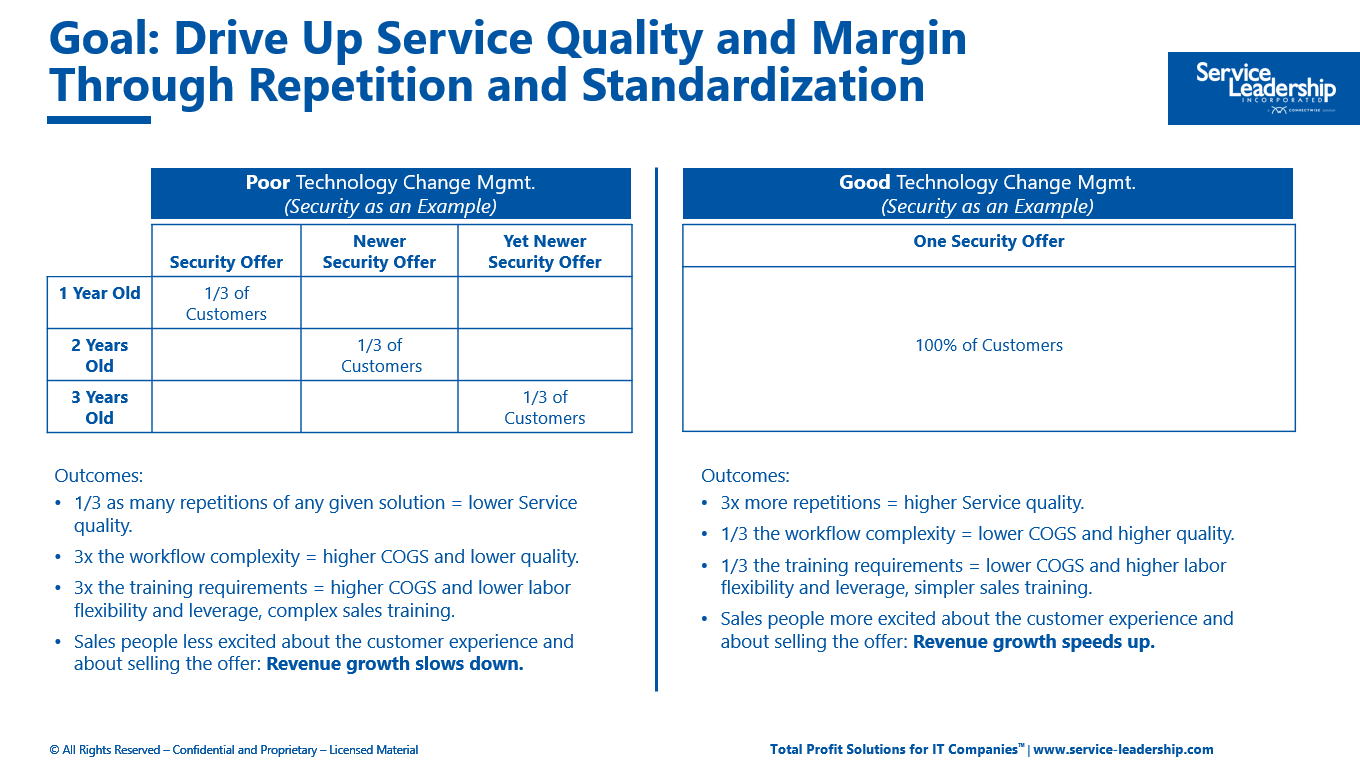
Top-performing IT Solution Providers of all business models, drive towards this full-utilized model across all the products they sell (whether hardware or cloud):
The strategy on the left side of the chart above, is the one most often pursued by the lower growth, lower profit IT Solution Providers, and they also struggle to deliver an exceptional customer experience. The strategy on the right side is the one carried out most often by the higher performers.
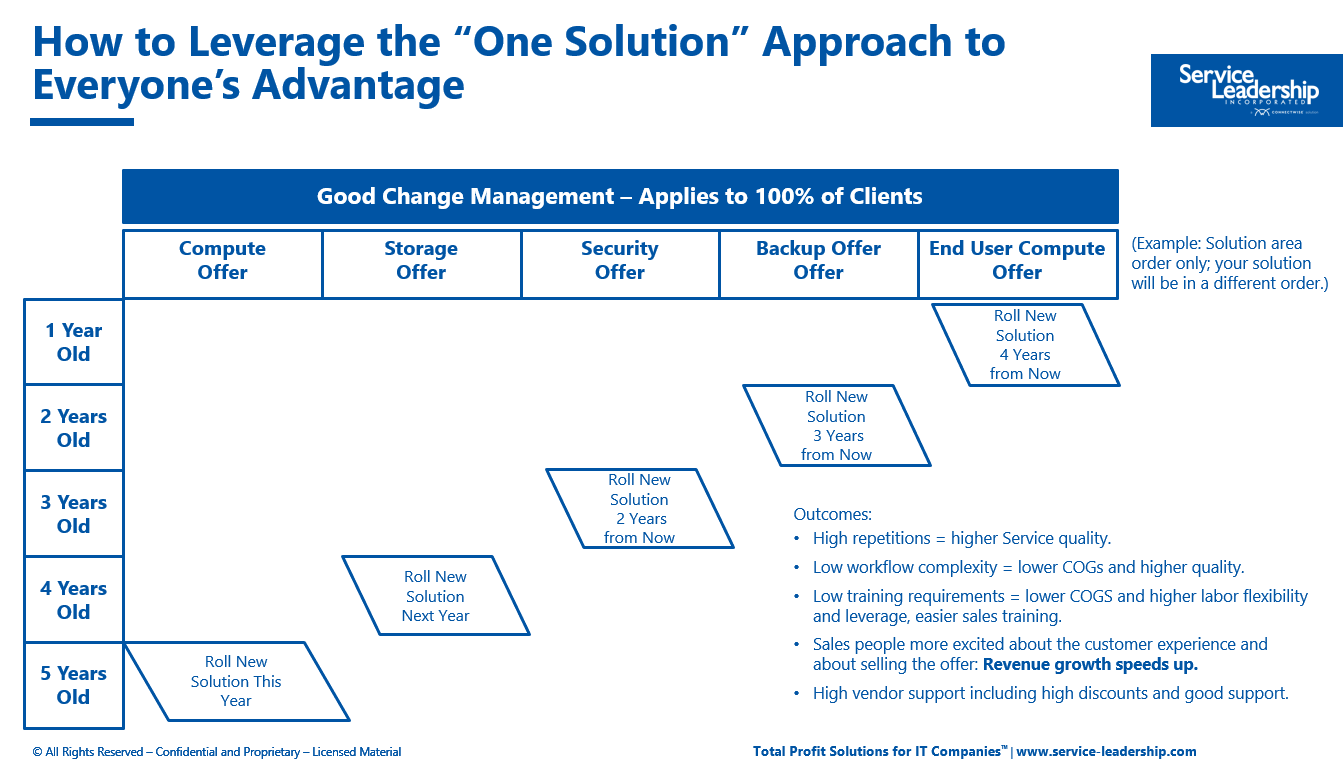
This then allows the higher performers to execute a layered or "striped" technology stack upgrade strategy, as shown below:
Each of these new product rollouts gains the advantages cited by the mid-sized MSP CEO mentioned above. Both the Project Services and Managed Services Factories gain material advantages, all of which translate back to the end customer in the form of a great customer experience and operational consistency, and the most predictable and well-managed IT capital and operating expense budgets.
Now, imagine you are a vendor who has channel partners. With regard to the productivity of their channel partners, vendors don't even get to the 80/20 rule. Instead, 10% of their partners produce 90% of their channel sales. Any vendor will tell you the bane of their existence is the new channel partner who eagerly signs up, but then just sells a few units before moving on to the next vendor's bright shiny object in the same product category.
Imagine that you come across an IT Solution Provider who describes in practical terms how, they programmatically get 100% of their customers on each of their selected vendors' products.3
Not only would you be eager to do business with them, but you'd also be willing to go some distance to meet their business terms. Especially so, if this was the second time you'd struck this deal, with this now-proven, high OML partner.
Here is how these high-performing IT Solution Providers discuss this with their candidate vendors:
"Dear Candidate Vendor,
- "We're about to replace Solution X across 100% of our clients.
- "We have 100 clients to install in the next 12 months.
- "We have a strong track record of getting 100% approval from our clients because:
- "For 100% of them, their current solution is five years old,
- "We have four Quarterly Business Reviews (QBRs) a year with each client, to specifically ensure we drive this conversion ratio.
- "So, this is a pre-approved budget item from them.
- "To use a supermarket analogy, we are offering you the opportunity to be the 'end cap' vendor for this solution in our 'supermarket’, and we attain 100% sell-through in 12 months.
- And you have a chance to unseat your competitor who currently occupies this space.
- "What will you offer us in terms of discounts, sales, and engineering support, NFR, etc.?"
With this approach, the high OML IT Solution Provider is not only optimizing their Project and Managed Services Factories, but also their product pricing and vendor support.
Now, the IT Solution Provider is creating the demand, not the vendor. They who create demand, win the Gross Margin.
How the Top-Performing IT Solution Providers Manage Their Brands and Their Vendors’
Which brings us to branding. A key part of demand generation is, as you know, effective branding. It’s no surprise, therefore, that high-performing IT Solution Providers emphasize their own brands, more so than their vendors’ brands.
Lower-performing IT Solution Providers in both the Product-Centric and Services-Centric PBMs, display their vendors’ brands on their websites. They expend marketing investment on building brand equity for their vendors, which means they invest less on their own brand.
These lower performers often believe that displaying the vendors’ brand and their vendor certification(s) helps with market differentiation. In fact – because end customers are less discerning about levels of certification than most vendors and lower-performing IT Solution Providers believe – most end customers simply believe than one vendor-certified IT Solution Provider is just as good as another with the same vendor brand.
Higher performing IT Solution Providers across all PBMs, generally have no vendor branding on their websites and marketing materials. All of their investment in branding builds equity in their own brand.
Think of high value brands in any marketplace – how much effort do you see them put into promoting the brands of the sources of the components they use in building their product. Answer: none.
In fact, looking at a IT Solution Provider’s website and seeing if, how many, and how prominently, vendors brands are on display is one of the few externally visible ways to gauge that IT Solution Provider’s OML. If they approach this with low OML – many vendor brands prominently displayed – the odds are better that they are lower OML in other ways. If vendor brands are not evident even in subordinate pages, they are high OML in branding, and odds are better they are higher OML in other areas as well.
Conclusion
Higher-performing IT Solution Providers turn the IT value chain around.
Instead of relying on vendors’ demand generation and vendors’ brands to create leads, they programmatically manage product adoption in their installed base of clients, to drive demand for the vendors.
Instead of building the vendors’ brand equity, they build their own.
They thus have a more successful business model: A more differentiated position in the marketplace, with higher efficiency Service Factories that produce a better customer experience at higher profitability, along with better terms and support from their chosen few vendors.