Recognized worldwide as the "IT solution provider industry's encyclopedia of performance," this report provides a wealth of information about the health and viability of solution providers within each specific Predominant Business Model™ (PBM™) in the industry.
The report includes 80+ metrics including, objective measures of financial performance and Operational Maturity Level™.
- Current valuations for median and top performers by PBM such as MSP and VAR
- Budget attainment in 2024 and planned for 2025
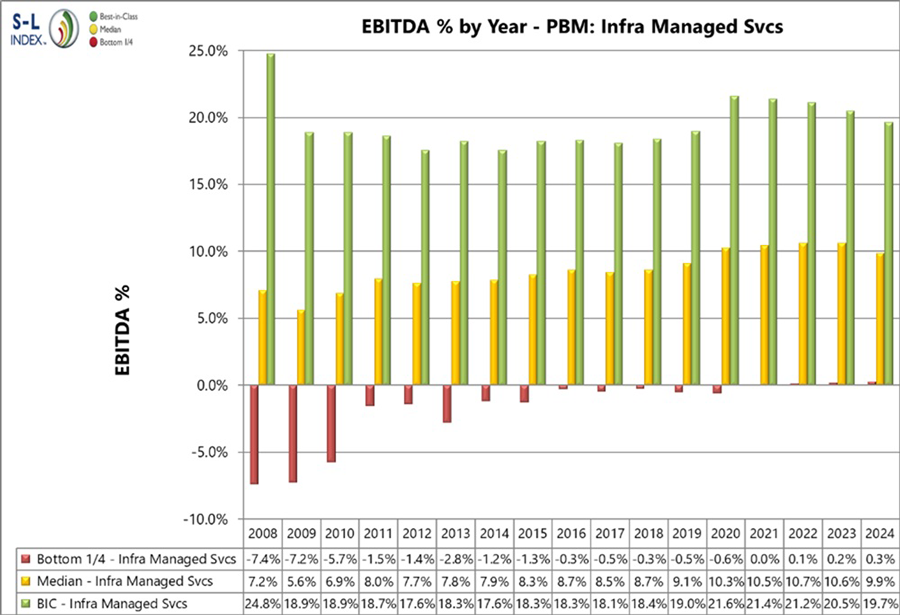
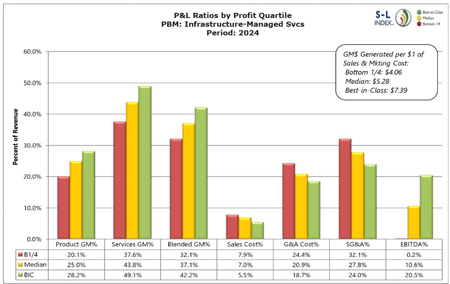
- Gross margins by line of business, sales, marketing, general and administrative costs in top, median and bottom quartile profitability firms by PBM
View Table of Contents
Download Executive Summary
BUY NOW AND GET THE REPORT