Fixing MSP Revenue Growth
How Big is the Market for SMB Managed Services, and How Can We Grow Faster?
Many Managed Service Provider (MSP) owners and executives will testify they are not happy with their Revenue growth. That doesn’t mean there isn’t growth to be had. The questions are, why aren’t they getting it, and what should they do?
We believe the total addressable market for SMB Managed Services in the United States is about $50bb, including recurring Revenue, product resale, and project Revenue. This $50bb is from win/win customers – the 25% of SMB companies that will pay a fair price for your fully-managed package – and there is probably another $25bb available from the 75% of SMB companies who will only engage in a win/lose arrangement (whom you should ignore).
MSPs at high Operational Maturity Level™ (OML™) focus solely on these win/win customers and only on selling their fully-managed package; these are key reasons they grow the fastest and have the highest profitability. With $50bb in total addressable market, if every MSP attains $10mm in Revenue, then there is “room” in the United States for about 5,000 well-performing MSPs of that size.
Yet, there are probably about 15,000 MSPs in the U.S., and the majority are well under $10mm in Revenue; in fact, the majority are under $5mm in Revenue.
How do we get to an average of $10mm in a meaningfully short period of time?
Contents
What is Average and Best-in-Class MSP Revenue Growth?
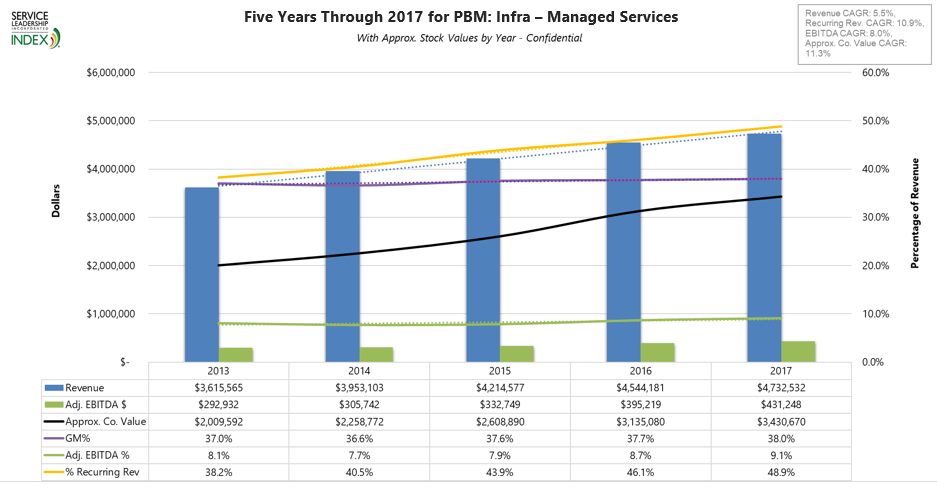
The chart below shows the Revenue growth of the average MSP in the Service Leadership Index® over the past five years.
This chart contains the same companies in each year, so year-to-year variation is due to the actual progress of the companies, not due to subscribers coming into or dropping out of the group. Some of these firms are individual subscribers to the S-L Index™, while some are in peer groups operated by us or by the peer group operators we serve, some have coaches and some do not. Some of these firms engaged in M&A during this time, some did not, so acquired Revenue growth is included in this chart.
The blue bars are the average top-line Revenue (from all services and products the MSP sold). The call-out in the upper right shows that the Compound Annual Growth Rate (CAGR) of top-line Revenue was 5.5% annually over the five-year period. This is faster than the growth of the national economies in which these MSPs operate, but not very fast if one’s goal is, for example, to double in five years. For the average MSP to have grown from $3.615mm in 2013 to double that ($7.23mm) by 2017, they would have had to have grown 14.8% annually – about triple the CAGR of top-line Revenue.
However, the call-out also indicates that recurring Revenue dollars are growing at about twice the speed of top-line Revenue: 10.9% annually over the five years. The gold line on the chart shows the proportion of recurring Revenue each year. Quick math tells us that in 2013 the average MSP had about $1.37mm in recurring Revenue, while in 2017 they had $2.31mm; about 10.9% growth per year.
This is better growth, but not yet the 15% CAGR we’d like, to be comfortable we will double in size every five years.
Why Aren’t Top-Line and Recurring Revenue Growing Faster?
To prescribe effective actions to accelerate Revenue growth, it’s best to understand what is and isn’t working for most MSPs today.
The table below shows the rate at which the average MSP added new-logo contracts in the second half of 2017.
| Q3 + Q4 2017 |
Average |
| Number of New Contracts Added |
7.1 |
| Total MRR $ Added x 3 Months |
$87,319 |
| Number of Users Added |
213 |
|
| Number of Contracts Terminated |
10.8 |
| Total MRR $ Term'd x 3 Months |
$90,597 |
| Number of Users Deducted |
332 |
|
| New Contracts Added (Deducted) |
(3.7) |
| Net MRR Added (Deducted) |
$(3,278) |
| New Users Added (Deducted) |
(119) |
|
| Fee/User/Mo Added |
$137 |
| Fee/User/Mo Deducted |
$91 |
| % Change Fee/User/Month |
50% |
| Sales Headcount* |
6.0 |
| New Contracts/Rep/Qtr |
0.6 |
*Total of Hunters, Farmers and Hybrid Hunter/Farmers
- The “Number of Contracts Added” is only new-logo contracts (i.e. companies who are entirely new customers to the MSP), during the second half of 2017.
- Thus “New Contracts” does not include expanded agreements with existing customers, and it does not include acquired customers (M&A).
- “Number of Contracts Terminated” includes contracts that ended during the second half of 2017. The terminations were for any reason: voluntary (i.e. the customer left the MSP) or involuntary (i.e. the customer was fired by the MSP).
- The “MRR” on this table is a single month’s fee times 3 (as though the contract had been in operation for three months, even though it may have started mid-quarter).
- The “Net Contracts Added (Deducted)” and the two rows associated to it, are simple math from the related rows above.
This data tells us a great deal about what is happening with MSP Revenue growth:
-
Net Growth in Number of Contracts – The average MSP in the last half of 2017 was terminating contracts faster than they were adding them, for a net decrease in contracts of 3.7 over the six-month period.
We know from discussions with many of these MSPs, that most of these terminations were involuntary, meaning the MSP terminated the customer. When MSPs finally get to about OML 3.4, they tend to go through a period of actively terminated the win/lose customers they typically signed 3-to-5 years (or more) earlier. Back then, the MSP was lower in OML, and as such either didn’t understand how a win/lose contract happens, or perhaps even why the contract was win/lose. At OML 3.4, the MSP not only knows what a win/win contract looks like but is closing mostly or exclusively win/win contracts (albeit not yet very frequently).
At this stage, the MSP is finding that win/win customers are significantly easier to keep happy, produce many more referrals and testimonials, make everyone inside the MSP feel better about the job they do, and are materially more profitable. The MSP comes to realize that the biggest detriment to progress, are the win/lose customers acquired when the MSP was lower OML. Feeling comfortable that they are now adding profitable win/win customers at a regular if not fast pace, the MSP starts to issue ultimatums to the win/lose ones: get standard, upgrade to our full package, and pay our current price, or leave.
One MSP at this stage related that he terminated 23% of his customer base, which comprised a mere 8% of his Gross Margin dollars but “80% of my heartburn.” With the extra time recovered from no longer constantly “rescuing” those win/lose relationships, he soon closed three new contracts which more than replaced the Gross Margin dollars – at materially higher profit – from the terminated clients.
Why is this happening more broadly now? In 2017, the average MSP had finally risen to OML 3.4.
-
Average Fee per Month per User – That the MSP at OML 3.4 is actively changing out loss-making contracts for profitable ones is evident in the rows labeled Fee/User/Month. In the second half of 2017, the average fee per user per month of the terminated contracts was $91.00. The average fee per user per month of the new contracts was $137.00 – a nice, neat 50% higher.
This dramatic increase in recurring Revenue per user is a result of two factors. First, bringing on customers who buy the fully-managed package, that is, delivering more value in return for receiving a higher fee. Second, it is due to simply charging more for the same package of services. Some of the terminated customers – often the majority of them – were already buying the fully-managed package. They were just paying the materially lower price charged by the MSP when it only knew how to sell on price.
All other things being equal, selling the same fully-managed package for 50% higher price is going to produce a materially higher gross profit and bottom line! Indeed, while the average MSP grew only 4.1% in Revenue in 2017, it grew more than double that rate in Adjusted EBITDA1 dollars: 9.1%. Growing the pile of profit dollars twice as fast the pile of Revenue dollars, results in a material improvement in safety, likely stock value, and “grief-to-profitability ratio” as we like to call it.
-
New Contracts per Rep per Quarter – Measured only by number of new-logo contracts won per rep per quarter, the average MSP has to be frustrated: In the second half of 2017, the average was 0.6 new contracts per rep per quarter. This is a run-rate of not even 2.5 new contracts per year for each sales rep. Some basic assumptions and analysis indicate anemic Sales efficiency:
| Sales Efficiency Factor |
Value |
| Average Users per Contract |
30 |
| Fee per User per Month |
$137 |
| Annualized Recurring Revenue per Contract |
$49,255 |
| Plus Product and Projects |
$100,727 |
| Gross Margin % |
38% |
| Gross Margin $ |
$38,276 |
| New Contracts per Year |
2.4 |
| Total New Gross Margin $ per Rep per Year |
$91,863 |
| Average Rep Taxable Wage |
$75,000 |
| Gross Margin Dollars per Dollar of Sales Rep Wage |
$1.2 |
The S-L Index™ tells us that in 2017, the MSPs in the top quartile of profitability, generated $7.93 of Gross Margin per dollar spent on all Sales and Marketing. Granted the calculation above only takes into account Gross Margin added from new contracts2, but its resulting $1.2 dollars of GM for each dollar of Sales Rep wage, leaves a large gap. We’ll examine how to improve this ratio, a bit later in this newsletter.
Summarizing the data in this section, MSPs aren’t growing Revenue faster because:
- They are terminating contracts faster than they are winning them. Most of this is on purpose: They are actively trading out loss-making customers for profitable ones. A smaller proportion is due to unwanted attrition but this will decline (not disappear) as the MSP continues to increase in OML.
- Given a net negative in new contract recurring dollars won versus recurring dollars terminated, since the average MSP grew recurring Revenue at around 10% in 2017 over 2016, this growth must be coming from healthily-evolving relationships with existing accounts:
- Expanding the package of services in their agreements and/or,
- Growing the number of users or devices being covered, and/or,
- Having their fee per user or device increased by the MSP.
- They are selling mostly or exclusively win/win contracts but are not yet capable of selling them very quickly. This is likely due to poor lead generation and poor sales skills, both of which we’ll address below.
While overall Revenue growth, and even recurring Revenue growth, frustrates a great many MSPs – and must be cured – they are improving their profit picture materially.
Twelve Ways Top-Performing MSPs Accelerate the Growth of Profitable Revenue
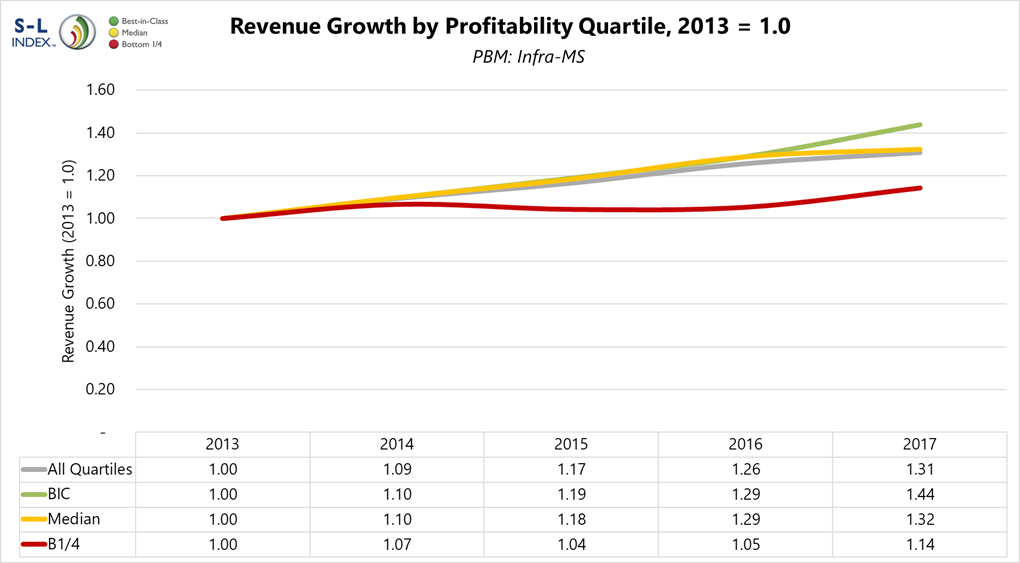
The chart below shows that the MSPs in the top quartile of bottom-line profitability (shown as “BIC” or Best-in-Class) are growing faster than the MSPs in the Median and bottom quartile of profitability.
This result is consistent across all types of Services-Centric Solution Providers (MSPs, Project-Centric firms, T&M hourly break/fix firms, etc.). Despite the commonly-held misperception that one must sacrifice profitability to grow more quickly, in Services-Centric firms, fast growth produces higher profit due to higher productive utilization of technical people. Higher profit in turn enables greater reinvestment in Sales growth.
As noted earlier, we also know that these top-quartile MSPs generate $7.93 of Gross Margin per dollar spent on Sales and Marketing, versus $5.94 for Median MSPs and $4.67 for bottom quartile MSPs.
What are the Best-in-Class MSPs doing to generate faster Revenue growth and greater Sales efficiency?
As you would expect from MSPs operating at higher OML, they are working all the angles: growth of new logo contracts, same account growth, sales staffing, optimized Revenue mix, pricing, and so on. We’ll examine all of these, below.
-
Growth of new logo contracts – Top-performing MSPs impact this critical area of growth in several ways:
-
Optimized Sales Staff – You’ll notice at the bottom of the table under Why Aren’t Top-Line and Recurring Revenue Growing Faster?, it says: “Total of Hunters, Farmers and Hybrid Hunter/Farmers.” In fact, the top-performing MSPs in the SMB space don’t have Farmers or Hybrid Hunter/Farmers, they only have true Hunters. That is, they only have Sales reps who, once they close a deal, receive a one-time commission and are never involved in, or paid for, the account again.
This helps ensure the Hunters they hire actually hunt for a living. When interviewing for a new job, most Farmers will claim to be Hunters; 90% either aren’t Hunters or won’t engage in Hunting beyond building “my base of customers”, which results in little hunting and slow growth.
As long as the MSP stays focused on SMB customers – defined as those accounts which have no remaining IT people after the MS contract is signed – then the accounts can be managed by vCIOs, who are in the Service group and in Service cost. One way the top-quartile SMB MSPs generate so many Gross Margin Dollars per dollar of Sales cost, is that they only have Hunters and no Farmers or Hybrid Hunter/Farmers, and the vCIO services are charged for in an increased per user or per device fee, adding to the Gross Margin dollars.
-
Optimized Marketing – Top-performing MSPs engage in more effective marketing (lead generation). There are several aspects to this.
First, they engage in Thought Leadership Marketing more consistently, deeply and effectively, which means they generate more brand awareness among more prospects who will accept a win/win relationship.
Second, their overall marketing investment is higher in terms of spending, and more strategic in terms of staffing. The top-performing MSPs are more likely to have director- and even VP-level marketing skills on staff and a significant relationship with an external marketing firm, while the lower-performing MSPs tend to have junior-level marketing people and tactical relationships with external marketing resources. Since this higher dollar-investment produces more account wins at higher margins, the ratio of sales and marketing spend to Gross Margin dollar generation, is more favorable.
-
Mergers and Acquisitions (M&A) – Yes, the M&A market is hot, and much has been discussed about this in the last few years, including by us. Obviously, buying one or more MSPs is a valid way to add new accounts in bulk and relatively quickly, but it’s a high-risk one. M&A is always risky for Buyers – it’s simply hard to be 100% sure of what you’re getting, hard to optimize price, and then success is predicated not only on what you’ve bought but more on how well you accomplish the integration. This is especially true given today’s multiples and the well-heeled buyers you’ll be competing with. Even at a very low price, buying the wrong thing can have negative growth effects. Approach buy-side M&A like a venture capital investment – a big win if it works, but with a big risk that it won’t. Assume that for the first year, the acquired assets will perform at only 90% of their previous year’s results, and if you still decide to do the deal, you’ll be safer.
-
Optimized Revenue per New Account – Top-performing MSPs also maximize their Revenue growth by focusing on optimizing (growing) the size of each new contract they win:
- Optimizing Their Leverage Within TCP – They stay within their Target Customer Profile (TCP, or number of users) to maintain their crucial operating and investing efficiencies, but within that TCP, they do migrate upwards over time in average account size. In the SMB TCP – 20 to 100 users – the Best-in-Class profitability MSPs average about 35 users per account, while the bottom quartile firms average about 22. This means the average account – assuming the per unit pricing is the same – yields 59% per Revenue in return for only a small increase in the cost and time needed to find and close an account.
- Increased Minimum Fee – Similarly, the top-performing MSPs over time raise the minimum MRR they will accept in taking on a new customer. Most recall the brave moment they decide $1500/month was their new floor, and the relief that brought to the P&L and ability to deliver good services. Many are now at $3500/month or higher, within the SMB space. Obviously, for a given rate of new account wins, or even a slightly slower one, more Revenue per account is going to drive Revenue growth faster. Thus, even if an account has only, say, 15 users, they’re still paying at least $3500/month.
- Higher Fee Per User – The increased minimum fee above, is gotten simply by not selling any account (even with few users) below that monthly total fee. Likewise, the top performers also increase their per-user (or per-whatever) fee per month. At OML 3.0 this is, on average, double or more what it was at OML 2.0. At OML 4.0, it will be about 50% higher than at OML 3.0. This is because of their MSP’s increased understanding of their true costs, and their increased ability to succeed at value-based selling instead of price-based selling.
- One Offering:Gold – The top-performing MSPs don’t sell Silver, Bronze or a la carte offerings, even as a wedge into the account (because most wedge-wins are never converted to fully-managed accounts). As with the techniques above, this accelerates Revenue growth by greatly increasing the Revenue per newly closed deal, without only a small deceleration in number of deals closed. It also simplifies Service and Administrative operations, which increases profitability.
-
Growth of Same-Account Revenue – Top-performing MSPs place focus on growing the Revenue of each existing account, as a separate emphasis from new-account selling:
-
Cross-selling – The mantra of the top performers is: 100% of customers buy 100% of our offerings. Just as they only originate new accounts on their Gold (or fully-managed) offering, each existing account is then managed to consume each and every one of the MSPs new offerings, as the MSP’s portfolio of offerings grows and as their standards evolve. The corollary to this is, the top-performing firms do not add offerings which cannot be sold to all their clients. Thus, each new offering or updated standard, gets sold the absolute maximum number of times (i.e. every one of our customers buy it), which drives multiple efficiencies. It optimizes:
- Revenue and Gross Margin dollars per account,
- Account Retention
- Gross Margin dollars per Sales and Marketing dollar,
- Gross Margin percent by simplifying the Service operations challenge, and
- General and Administrative cost efficiencies by simplifying billing.
-
Qualifying Prospects for Likely Growth – Top-performing MSPs also qualify new prospects by the likelihood that the customer will be good at growing its own business and thus needing to hire more people.
As the customer grows, its number of users grows, and the MSP has a significant organic growth booster. If the MSP wants to grow by 15% a year, and any given customer is growing its headcount by at least that much, then the MSP has significant built-in help meeting its growth goals.
Two ways to qualify a new prospect for its ability to grow: 1) when you are exploring their business goals with them, ask about their growth over the last three years, and 2) ask the prospect for their five-year business plan. If they don’t have one, the odds they’ll grow are significantly lower than if they do. And if they have one and won’t share it early on in your budding relationship, they likely either don’t understand the value of strategic relationships, or they don’t have the trust for one, both of which mitigate against their future growth.
By the way, it’s critical to note that, the more users a customer has, the higher your per-user fee per month should be. While it seems logical that economies of scale should enable you to lower your fee per user as the number of users in the account grows, in fact, bigger accounts (and faster-growing ones) take more resources and investment to serve.
-
Weeding Out Low-Performing Accounts – As we noted under Why Aren’t Top-Line and Recurring Revenue Growing Faster?, when an MSP reaches about OML 3.4, they actively terminate sub-optimal customers who will not upgrade to a win/win relationship. Revenue growth comes from this, in two ways: 1) some do upgrade and, 2) if the poor account leaves, more time and better referrals are available to go win new accounts. Rule for safely terminating sub-optimal accounts: win a great new account, terminate two sub-optimal accounts; win a good-but-not-great new, terminate one sub-optimal account.
-
Increasing Prices Top-performing MSPs raise their per-unit fees for new customers and every existing customer, every year, by at least the increase in cost-of-living, like clock-work. Have you ever wondered why your local copier sales rep can offer you a new copier to replace that three-year-old one, at a lower monthly payment? Read you contract: it likely has a 12.5% increase in service contract fees per year. Rent a storage unit somewhere? Check your monthly bills: likely every third month, you are paying 2% more. Aren’t IT services just a little stickier than copiers and storage units?
-
Revenue Mix – Most MSPs let product and project Revenue growth meander along. This is for two reasons. First, becoming a higher-OML MSP requires a great deal of sustained focus. It isn’t until about OML 3.4 or so, that finding and closing win/win customers becomes somewhat easier and less consuming of strategic thinking. Second, most MSPs came from a more product- and project-centric business model and have a hard-earned disrespect for those forms of making a living.
Ironically, at about OML 3.7 or 3.8, MSPs change their tune with regard to product resale and the projects that go with it. Yes, they’re of course, standardizing and stabilizing every new client’s environment with the right products. No, they’re not chasing product deals to non-managed clients. But they also purposefully accelerate their sales of product and projects to their existing client base.
Why? To optimize both Revenue growth (a win for themselves) and the value provided to the customers (a win for the customers).
How? They make sure to have all their Quarterly Business Reviews. They make sure they have a 3-5 year technology roadmap for each client, updated and agreed to quarterly, and they make sure that roadmap includes a judicious line-up of new product-based offerings that help the clients reach their business goals.
To Double or Not to Double? That Is the Question.
If your goal is to double your top-line Revenue every five years, you’ll need to grow 15% each year, likely using as many of the twelve techniques described above as you can.
Remember, however, if your goal is to double your stock value over the next five years, then you’re better off growing Revenue more slowly and instead driving your Adjusted EBITDA % to top quartile. Remember that average MSP we showed in What is Average and Best-in-Class MSP Revenue Growth?:
- They’re about $4.7mm in Revenue at 9.1% Adjusted EBITDA today (that is, about $431,000 in Adjusted EBITDA dollars), and worth perhaps $4.3mm at today’s multiples.
- To double their value, they only need to grow about $1mm in recurring Revenue over the next five years – a mere 7.4% CAGR in recurring Revenue and a paltry 3.9% in top-line Revenue – if they can at the same time, get to top quartile (18.1%) Adjusted EBITDA over the same time.
- Meanwhile, even if they don’t actively plan to sell then or at any time, they’ve increased their annual pile of Adjusted EBITDA dollars from $430k to nearly $1.1mm. This is a big increase in safety and ability to reinvest or diversify investments, and a material boost in lifestyle.
As always, it pays to know your goals: Double your Revenue, or get to Best-in-Class Adjusted EBITDA? How about both?
ABOUT SERVICE LEADERSHIP, INC.
Service Leadership is dedicated to providing total profit solutions for IT Solution and Service Providers, directly and through industry consultants and global technology vendors. The company publishes the leading vendor-neutral, Solution Provider financial and operational benchmark: Service Leadership Index®. This includes private diagnostic benchmarks for individual Solution Providers and their business coaches and consultants. The company also publishes SLIQ™, the exclusive web application for partner owners and executives to drive financial improvements by confidentially assessing and driving their Operational Maturity Level™.
Service Leadership offers advanced peer groups for Solution Providers of all sizes and business models, and individual management consulting engagements for Solution Providers from US$15mm to US$3bb in size worldwide. In addition, Service Leadership provides global technology OEM with advanced partner enablement assets, partner ROI models, management consulting and advanced peer groups, as well as executive and industry best practices education and speaking. Please visit www.service-leadership.com for more information.
Notice: All materials published (electronically or print) by Service Leadership are proprietary and subject to trademark and copyright protections, regardless of where and how it is sourced. The terms and concepts of SLIQ™, Service Leadership Index®, (S-L Index™), Predominant Business Model™ (PBM™), Operational Maturity Level™ (OML™), Normalized Solution Provider Charts of Accounts™ (NSPCoA™), Total Cost of Managed Services™ (TCMS™) and Service Factory™ are proprietary to Service Leadership, Inc. All Rights Reserved.
1 Adjusted EBITDA: Earnings Before Interest, Taxes, Depreciation and Amortization, adjusted so that owner fair market compensation is taken from the Income Statement, not the Balance Sheet.
2 Meaning, it doesn’t include Gross Margin dollars from new sales to existing accounts the Sale rep may be managing. Likewise, the company’s ratio of Gross Margin dollars to Sales and Marketing cost may be higher, because non-Sales activities (such as vCIOs) may be generating Gross Margin.