Rapid Recovery Planning Guide -
A Service Leadership Asset
As of this writing, the COVID-19 lockdown continues to escalate, and it is unknown the extent to which it may be escalated to manage the impact of the virus. In addition, the collapse of oil prices – normally an economic event of material consequence – is hard to detect amid the virus-caused slowdown in the worldwide economy, unprecedented in modern times.
The immediate future is uncertain, and yet we must plan and execute to keep our Solution Provider businesses moving ahead, and continue to serve our shareholders, business partners, customers and employees and their families as well as possible.
This newsletter suggests methods to plan and execute successfully in the current circumstances which are drawn from our experiences managing through previous recessions, and our current, daily, and often urgent work with clients and members.
This newsletter has four main sections:
To aid you in finding the precise information you would like, we provide a more detailed Table of Contents below.
For those not interested in the first two sections on the likely economic planning context for Solution Providers, go straight to “Actions to Maximize Revenue, Profit and Safety” and read that section.
For those with very little time to read, go directly to the “Start of Recession Checklist of the Best-in-Class”. See also the two “Recommendations for Driving Revenue in a Recession” tables.
Table of Contents
Table of Figures
What Are the Likely Upcoming Macro-Economic Scenarios?
The first thing we need to do is understand the likely trajectory of the business economy for which we are planning. The situation is unprecedented, but as we survey the available macro-economic analyses, we see that three scenarios seem to be commonly identified by the various experts:
- A “V” shaped recovery – meaning a short, sharp, shock and then quick jump back up to something like full steam by Q3 or Q4.
- A “U” shaped recovery – more like 18-36 months before a substantive recovery begins.
- An “all bets are off” extended economic disaster of unknown duration and depth but worse than Scenario B, above.
It is beyond the scope of this document and our abilities to predict which of these might be most likely to occur, but we will pick Scenario B as our planning scenario, for reasons we’ll shortly explain.
We are not experts in the field of economics outside of the Solution Provider industry. The situation is unprecedented in modern times, but there are perhaps some clues that can give us a sense of context.
In most recessions, the fact that a recession is occurring is often uncertain in its early stages, as is its ultimate depth and duration. In fact, for this reason, the U.S. Bureau of Economic Analysis, which is officially chartered with declaring recessions in the United States, purposefully doesn’t do so until two or three quarters after the recession has begun (and thus possibly after the recovery has begun).
In contrast, in this case – as with the September 11, 2001 attacks – the trigger of today’s economic slowdown is obvious.
Also, in parallel with the September 11 attacks, at least some of the slowdown is wisely mandated by governments. In the case of September 11, the U.S. federal government ordered the skies to literally be emptied; within an hour all non-military air traffic was grounded. The impact on the finances of the commercial airline industry was immediate and material.
Similarly, today governments worldwide have ordered what is in effect a “grounding” of much of the commerce that cannot be conducted in the virtual world. As much physical world productivity continues as possible, of course:
- Essential construction and transportation,
- Such healthcare as can be continued,
- Such manufacturing which can be continued,
- Such supply chain as can be continued,
- And so on.
Regardless, the economic impact will be substantial.
What One Blue Chip Analyst (Goldman Sachs) Currently Thinks
There is no lack of opinion in the news, but to provide some expert context, here is Goldman Sachs’ opinion of what may happen macro-economically, as of March 20, 2020. They reportedly expect Q1-20 U.S. GDP to drop by 6% from Q4-19 and then by another 24% in Q2-20 from Q1-20. Here is their prediction expressed monthly:
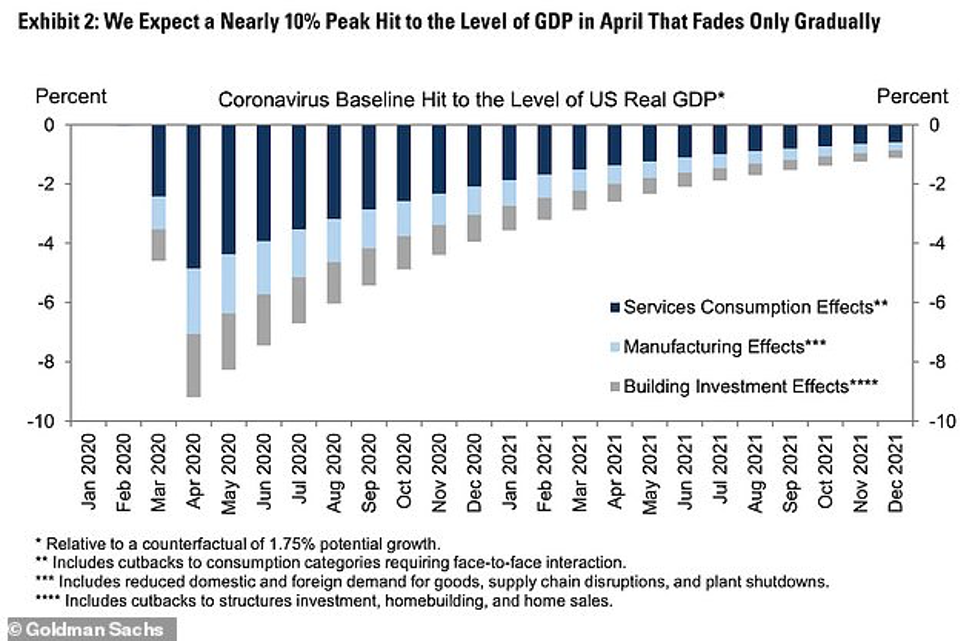
Figure 1 - Source: Goldman Sachs 3/20/20 projection for recession impact, for via the Daily Mail (UK)1
To quote the Daily Mail: “That would be more than double the largest quarterly drop in (U.S.) GDP on record, which is a 10 percent decline in the first quarter of 1958 during the 'Eisenhower Recession.'”
This is just in the United States. Similar lockdowns are wisely being enacted – with concomitant economic slowdowns – in many if not most countries around the world.
Regardless of this difficult picture, we know two things. First, the situation often turns out to be not as bad as it at first seems. Second, we will survive, and many will thrive. Let’s talk about how.
The Scenario We Will Use in This Newsletter
We outlined three scenarios at the start of this newsletter:
- A “V” shaped recession with a recovery within a year,
- A “U” shaped recovery starting in 18-36 months,
- An “all bets are off” economic disaster of unknowable impact.
We’re going to focus on Scenario B. Many of the actions we suggest in this newsletter are applicable to Scenario A and Scenario B. However, Scenario A, with its short-term nature, requires the least planning, and Scenario C, by its extreme nature, makes it impossible to fully address.
We also believe Scenario B is the most likely outcome, though we are hoping and praying for Scenario A.
While we all hope for Scenario A or something better, we would be wise to be planning for Scenario B.
Likely Solution Provider Revenue and Profit Paths Through Recovery
In late 2018 and early 2019, many Solution Providers were worried about a recession occurring in 2019. In March 2019, we published a 12-page advisory, in which we outlined the strategies used by those Managed Services Providers (MSPs) and Product-Centric firms (VARs and Resellers) who had most successfully navigated previous economic downturns of various magnitudes. Later in the year, we built on that in our Service Leadership Index® (S-L Index™) Annual Solution Provider Industry Profitability Report™, in a section called “Recession Contingency Planning.” We’ll leverage both resources in this discussion.
Revenue and Profitability Outcomes of the Past Recessions
Because the Service Leadership Index has uniquely benchmarked the largest population of Solution Providers in the most detail, for the longest time (every quarter for nearly 15 years) in the industry, we can share the most accurate view of what happened to Solution Providers in the “Great Recession” of 2008-09. In addition, we have successfully managed our own Solution Providers firms through previous recessions.
It is a possibility the depth of even the “Great Recession” will turn out to have been shallower than the one resulting from our current situation, but it does offer a fact-based view which is instructive to us today.
Here, we look at the impact of past recessions on three Solution Provider Predominant Business Models™ (PBMs™)2:
- VARs and Resellers (whom we formally title “Product-Centric” or P-C) who make up about 9% of the Solution Provider population but account for about 69% of the traditional product resale driven through the channel,
- MSPs (whom we formally title “Infra-Managed Services” or I-MS) who make up about 36% of the Solution Provider population, and
- Private Cloud providers (whom we formally title “Infra-Shared Services” or I-SS) who make up about 2% of the Solution Provider population.
Although we don’t include them in the charts below, we will comment on the impact of recessions on Project Services companies, whose predominant Revenue stream is from implementations of infrastructure (such as data center builds, large scale roll-outs, and so on), and the most successful navigation strategies of those companies.
Impact on Product-Centric Firms (VARs and Resellers)
In the recessions of 2001 and 2008-09, P-C firms’ Revenue dropped quickly (within two quarters), on average declining about 45%.
Customers can curtail capital spending – on IT and any other capital investment area – very quickly. To remain intact, a customer order for product must generally fulfill one or both of these conditions:
- An immediate and undeniable business need, and/or
- It must be part of a contract which allows for no exceptions.
Obviously, the Revenue of P-C firms doesn’t drop to zero, so there must be a fair bit of business which meets one or both conditions.
One area that P-C (and other) firms should pay attention to is the immediate infrastructure changes needed to accommodate the shift in customer workload patterns brought on by a recession. The obvious example in today’s situation is the rapid deployment of “Work From Home” infrastructures.
We will address successful coping strategies for P-C firms during recessions in a few moments.
Impact on MSPs (Infra-MS Firms)
The SMB-focused Managed Services business has only weathered one recession (2008-09) just as they were gathering steam. Therefore, we don’t have multiple data points to inform what will happen to SMB MSPs in today’s situation, but we can guess.
In past recessions, Mid-Market and Enterprise MSPs Revenue dropped about 30% over the first one to three quarters. One might ask, “Managed Services is by definition, contracted recurring Revenue, how can it decline so much?”
Regardless of which size customer they focus on, three things occur which impact MSP’s contracted recurring Revenue during economic downturns:
- Some existing customers become unable to pay (i.e., effectively go out of business),
- Most existing customers reduce their employee count, which reduces the Revenue of MSPs billing by user and billing by device count (since clients will quickly figure out which devices are no longer being used),
- Many customers will ask for discounts and/or reduced levels of service in exchange for reduced fees (“We’re asking all our vendors to cut their invoices to us by 30% for the balance of 2020 and 2021.”).
These factors, along with a drop in IT capital spending by their customers, mean that MSPs generally experience a 30% drop in Revenue within the first three quarters of the start of a recession.
We will address successful coping strategies for MSP firms during recessions in a few moments.
Impact on Private Cloud Companies (Infra-SS Firms)
In past recessions, these firms have fared fairly well, dropping only about 10% in Revenue in the first three quarters. This lesser downturn is a result of three factors:
- In general, Private Cloud is the stickiest of all PBMs,
- In recessions, it is additionally unlikely that existing customers will undertake the risk and cost of “taking back” their server workloads by either rebuilding their own data centers or moving to another cloud provider (unless the customer is materially concerned about the current cloud provider’s own business resilience),
- Many companies who are not customers look to reduce their operating expense exposure by moving server workloads from their own data centers to cloud providers.
That said, empirically, the Private Cloud business model is one of the most difficult and risky of all Solution Provider business models, and we do not recommend that those Solution Providers who do not have a Private Cloud business, or whose Private Cloud business isn’t healthy, increase their investment in this area.
We will address successful coping strategies for Private Cloud firms during recessions in a few moments.
Impact on Project Services Firms/Companies (Infra-Project Services) and Project Services Practices
Unfortunately, of all the PBMs, Infra-Project Services firms experience the greatest financial challenges during downturns, for a simple reason.
As with Product-Centric firms, Infra-Projects firms rely on customers making capital investments which, as we have noted, customers are capable of quickly shutting down.
From there, the economic journeys of Product-Centric and Infra-PS firms during recessions, diverge:
- When a Product-Centric firm experiences a stoppage of customer orders, they in turn can radically reduce their Cost of Goods Sold (COGS) – they simply stop ordering product. The drop in Gross Margin dollar production means they have to rapidly resize their Sales, General and Administrative (SG&A) expenses, but – and here is the key – they can usually rapidly ramp back up their sales volume when orders resume, because they can simply start ordering product again.3
- In contrast, when an Infra-Project Services firm experiences a stoppage of customer orders, although they can reduce their COGS quickly, they generally do not. Why not? Because for Infra-Project Services firms, reducing COGS primarily means terminating the techs and engineers on their Project Services teams. There are three reasons they are usually reluctant to do so:
- Much of their methodology for successfully delivering projects exists in the heads of those technical people, so terminating them means losing valuable, hard-to-recreate intellectual property4,
- They will, perhaps correctly, believe that re-hiring new technical people once the recession recedes, will be difficult and will thus delay their ability to ramp Revenue back up, that is, to re-expand the capacity of their Service Factory™, and
- These people are valued members of the “company family” who have contributed to the company’s past success and perhaps even sacrificed income to help the company weather past financial challenges.
As a result, during downturns, Infra-Project Services firms typically experience substantially more financial stress than do the other PBMs.5
This can be seen in the chart below, comparing the change in profitability of Product-Centric firms and Infra-Project Services firms, during and coming out of the recession of 2008-09.
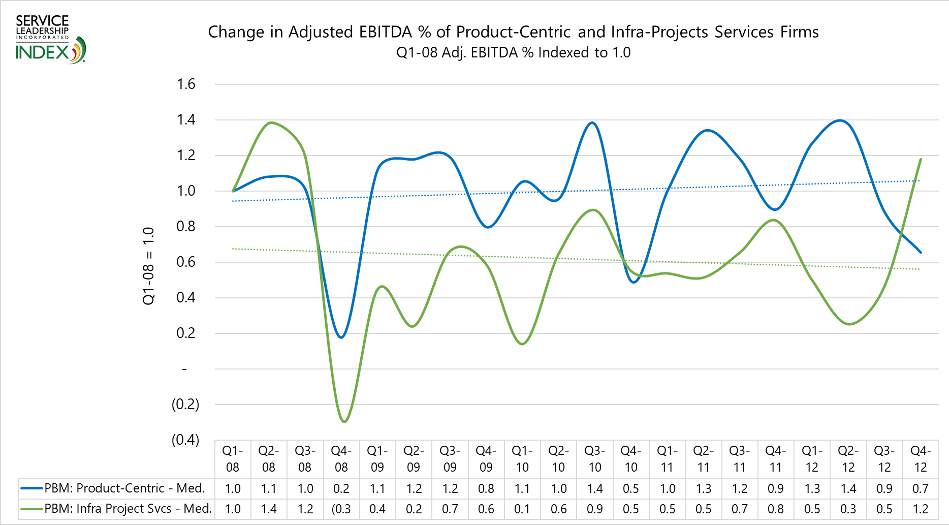
Figure 2 - Recession and post-recession profitability of Product-Centric and Infra-Project Services firms
Compared to Q1-08 (our “Index” quarter, meaning that quarter’s result =1.0), in Q4-08, the point at which the recession was in full swing, we see that the Median Product-Centric firm (P-C) had an Adjusted Earnings Before Interest, Taxes, Depreciation and Amortization (EBITDA) Percentage of 0.2 times what it was in Q1-08 (the first quarter of the recession and itself already down from the strong economy of 2007). Meaning that in actual Adjusted EBITDA % in P-C firms, the result in Q1-08 was 4.5%, then in Q3-08 it was a mere 0.8%.
This is certainly a sharp fall-off in profitability, and one should keep in mind that this thin Q3-08 profit percentage was against a 45% Revenue decline, which means profit dollars were very thin indeed.
Now look at the Infra-Project Services firms: In Q3-08 they had dropped even further than Product-Centric firms, into negative profit territory with 0.3 x the profit percentage they had had in Q1-08. In financial terms, they had gone from 9.3% Adjusted EBITDA % in Q1-08 to -2.6% in Q3-08.
As hard as this deceleration was on Product-Centric firms, it was more difficult for Infra-Project Services firms. Why did the Infra-PS firms drop this hard?
- They didn’t reduce their COGS in the face of reduced orders as quickly as did the Product-Centric firms; that is, they didn’t terminate technical people.
This chart serves to illustrate another useful relationship between Product-Centric and Infra-PS firms:
- You will note that the upturns and downturns in profitability of the Infra-PS firms roughly lag those of the Product-Centric firms by one to two quarters.
Generally, this “sonic boom” effect of Infra-PS firms doing better (and worse) one or two quarters after the Product-Centric companies has been consistent over the decades. This is because customers buy equipment, and then need it installed. Often – and to the surprise or bewilderment of the Product-Centric firms who have their own Project Services teams – the Infra-PS firms are installing equipment the customer bought from the Product-Centric firms.
As often as not, it takes the customer, and the project team they have engaged, several months after the equipment is shipped to actually pick it up and put it in place. Customers are invoiced for equipment when it ships; they are invoiced for projects when the project is done (or perhaps at best when phases of the project are done). Thus, project Revenue frequently lags equipment Revenue by a quarter or two.
Another factor made clear by the chart is that – although the 2010-12 time period was officially a recovery, it was a weak one. While the Product-Centric firms did trend weakly upward, the Infra-PS firms trended downward, again because of their tendency to hold on to COGS, that is, hold on to technical people in the face of uncertain demand.
We will address successful coping strategies for Infra-Project Services firms during recessions in a few moments.
Solution Provider Financial Performance During Recoveries
Generally speaking, since its advent in the mid-1950’s, businesses have turned to increased computer usage in boom times to accommodate and capitalize on growth, and in bad times to increase automation, usually to reduce COGS and/or SG&A expenses.
Despite the ubiquity of IT in today’s business, government and personal activities, we believe this downturn will fuel continued investment in IT. The initial effects of this, of course, can be seen in the urgent orders of laptops and tablets being placed by customers who are ill-prepared for the “Work From Home” mandate. Likewise, no doubt, personal, commercial and government networks are being rapidly upgraded to accommodate a massive shift in data and voice traffic patterns. Probably the volume of workload being transferred to the public and private cloud providers will go up, perhaps substantially, so that customers don’t need to be responsible for their own data centers in the midst of rapid change.
At the same time, we fervently hope the following piece of data isn’t relevant:
- We know from our anecdotal experience and then our study of the impact of Hurricanes Irma and Harvey, that Solution Providers in natural disaster areas actually do better financially for the next one to two quarters than they were previously, and also than their peers in non-effected areas.
Thus, while we expect Solution Providers to have worse financial results in the next few quarters than they would have had, if the boom had continued, we do expect both they and the IT industry as a whole to recover, and perhaps recover faster than the general economy.
What is a Possible Trajectory to a Recovery?
We can start by examining the Revenue and profit recovery of Solution Providers in the U.S. after the 2008-09 recession. This chart (Figure 3) shows the growth in Revenue since 2009 – the last year of that recession – of the Solution Providers in three PBMs: Product-Centric, MSPs (Infra-MS), and Private Cloud providers (Infra-SS).
Figure 3 shows these Revenue trajectories:
- Mid-Market and large clients historically turn to MSPs in a recession to better manage cost and risk during the downturn. Most MSPs (“Infra-MS” here), are SMB-focused, a new segment since 1999. It’s unclear if SMB clients will do the same.
- Product-Centric firms were hit hard in 2008, dropping about 45% in Revenue. Clients delayed new buys; fast P-C growth from 2009 to 2014 was “catch-up” spending, then growth stalled as many shifted to driving profit not volume.
- Private Cloud (Infra-SS) firms were similar to P-C: more gradual growth to 2015, then a big jump, then also stalled. Hard to say if I-SS took sales from P-C, but clearly clients have “caught up” on compute capacity.
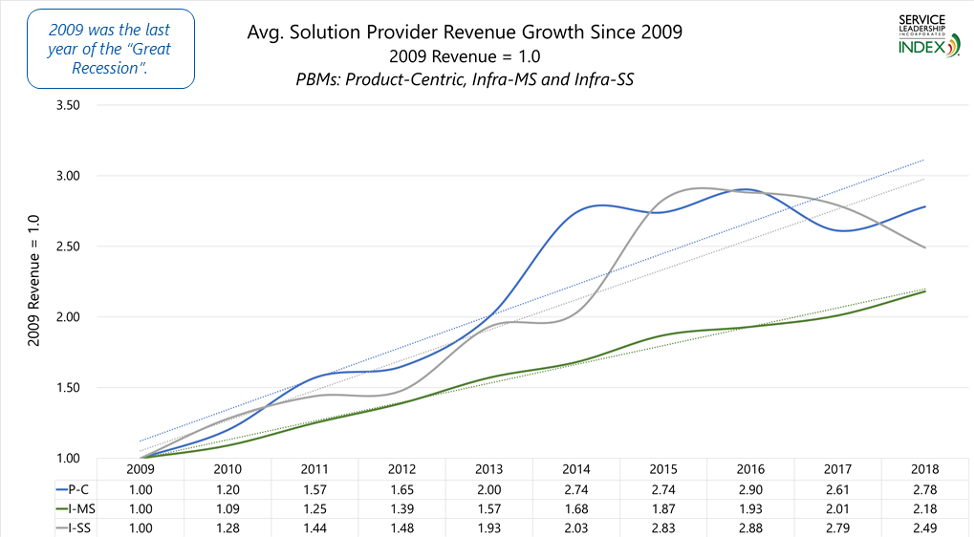
Figure 3 - Revenue growth of the average Solution Provider in each of three PBMs, since the last recession
Figure 4 shows the change in profit (Adjusted EBITDA percent) of the same three PBMs during the same time period. This is a somewhat dizzying chart – which reflects the real volatility of bottom line profits.
- Product-Centric – EBITDA % climbed sharply as Revenue started to grow in 2010, and again in 2013 as growth shot up. By 2014, P-Cs’ previous SG&A cuts were relaxed, and competition continued to heat up, pressuring profits.
- MSPs (Infra-MS) – Rapid EBITDA % gains in 2009-12, then a downturn, then slower improvement. The average MSP was about $2.6mm in Revenue in 2009, but by 2013 was about $4.2mm. This requires more overhead and a more complex management environment. This, more than competition, has slowed improvements in Adjusted EBITDA %. 2018 indicates renewed progress and 2019 (not shown) was even better.
- Private Cloud (Infra-SS) – While theoretically a smoothly scalable business, Cloud Services often have trouble keeping Revenue growth where it needs to be for consistent profits.
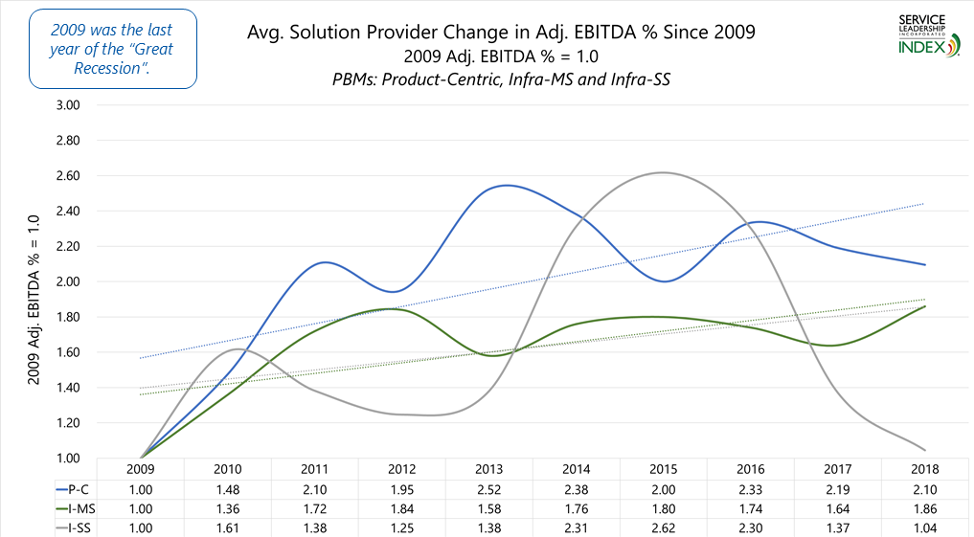
Figure 4 - Change in Adjusted EBITDA % of the average Product-Centric and MSP firm since 2009.
Our Projections for This Recovery
We outlined three scenarios at the start of this newsletter:
- A “V” shaped recession with a recovery within a year,
- A “U” shaped recovery starting in 18-36 months,
- An “all bets are off” economic disaster of unknowable impact.
In this section, we’re going to focus on Scenario B. Many of the actions we suggest in this newsletter are applicable to Scenario A and Scenario B. However, Scenario A, with its short term nature, requires the least planning, and Scenario C, by its extreme nature, makes it impossible to fully address.
We also believe Scenario B is the most likely outcome, though we are hoping and praying for Scenario A.
The charts that follow show two planning cases:
- “Bust” which shows what we think will happen if Scenario B happens, and if Scenario B is a recession roughly of the same magnitude as the “great Recession” of 2008-09.
- “Boom” which, for context purposes, shows what would have happened if the economic boom of the last 5-6 years had not ended several weeks ago and had instead continued.
These are shown for two PBMs: Product-Centric and MSPs (Infra-MS). Figure 5 shows our Revenue projections.
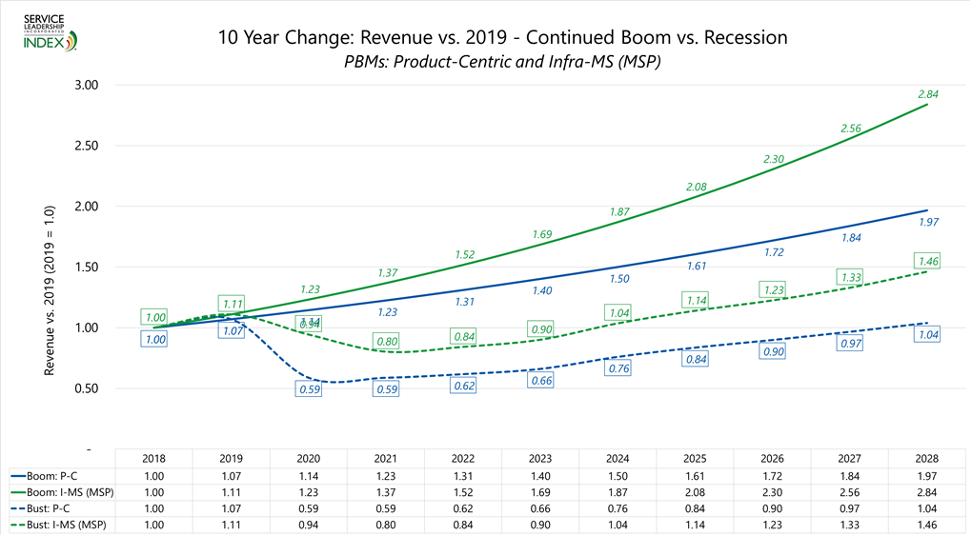
Figure 5 - Revenue projections for P-C and MSPs firms in a "Scenario B" recession (dotted lines)
For Product-Centric firms:
- The “boom” scenario projects 7% growth annually for P-C firms and 11% growth annually for MSPs. For P-C firms:
- In the recessions of 2001 and 2007-08, P-C firms’ Revenue dropped quickly (within two quarters), on average dropping about 45%.
- That’s what we have projected here for 2020: a 45% drop from 2019 (which is up 7% from 2018).
- This will be followed by a year of flat Revenue, then rapid growth for two years, tapering off to moderate growth thereafter.
- Because they’re also capital expense-dependent, Infra-Projects firms will have a drop in Revenue like P-C firms, albeit one to two quarters later.
- The other capital expense-dependent PBM, Applications-Projects, will also drop, but may recover more quickly if applications can provide material benefits to cost efficiency or enable new Revenue.
The blue dashed line shows what we project Revenue to do in a recession, for Product-Centric firms pursuing all customer sizes.
For MSPs:
- While the Mid-Market and Enterprise MSPs have weathered multiple recessions, the SMB MSP business has only weathered one (2008-09) just as they were gathering steam. We don’t have multiple data points to inform what will happen to SMB MSPs, but we can guess.
- In past recessions, Mid-Market and Enterprise MSPs dropped about 30%, taking two years to do so. That’s what is shown here, for all MSPs. From there, MSPs have two counteracting forces:
- Recurring Revenue drops because existing clients go out of business and cease to be clients, and many others reduce headcount and/or ask for reduced SLAs, both reducing fees.
- In Mid-Market and Enterprise, doing more outsourcing to an MSP is an accepted recession strategy. SMB CEOs may outsource more or may just cancel contracts. Lower Mid-Market firms will likely fire their small IT staff and outsource more.
The green dashed line shows what we project Revenue to do in a recession for MSPs pursuing all customer sizes, including SMB.
Figure 6 shows our Adjusted EBITDA percent projections, for both “Bust” (Scenario B) and “Boom” cases, for Product-Centric and MSP firms.6
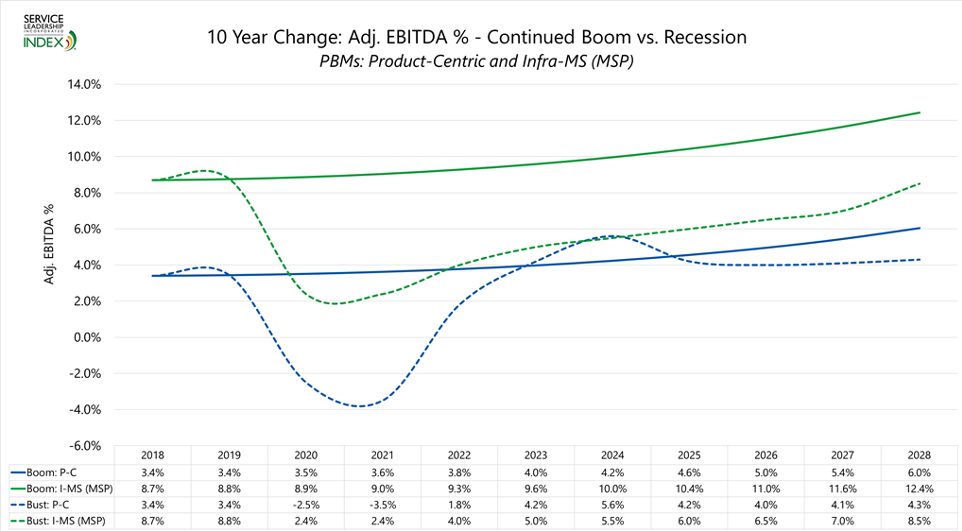
Figure 6 - Adjusted EBITDA projections for MSPs and Product-Centric firms in a Scenario B recession (dotted lines)
- The Median P-C firms will likely go to negative profit; one or two quarters later than their Median Infra-PS colleagues who will do the same but more so. Then both will start to recover, with Infra-PS firms again lagging by a quarter or two.
- Median Infra-MS firms will likely drop nearly to 0% Adjusted EBITDA but will probably not go negative. They will recover on a more gradual basis as they slowly raise existing customers and convince new ones to bet on the future.
In Figures 7 and 8, we show the Revenue and Profit dollar projections for a Scenario B recession for the average P-C and MSP firms.
The reason we are showing dollars instead of percentages or degree of change, is that it can sometimes be hard to relate percentages and indexed numbers to management’s perception and understanding of the reality of the situation. We don’t wish to belabor the unpleasant here, but instead to make clear the challenges management will need to face.
Figure 7 shows the Revenue of the average P-C and MSP firms, in a Scenario B recession and recovery.
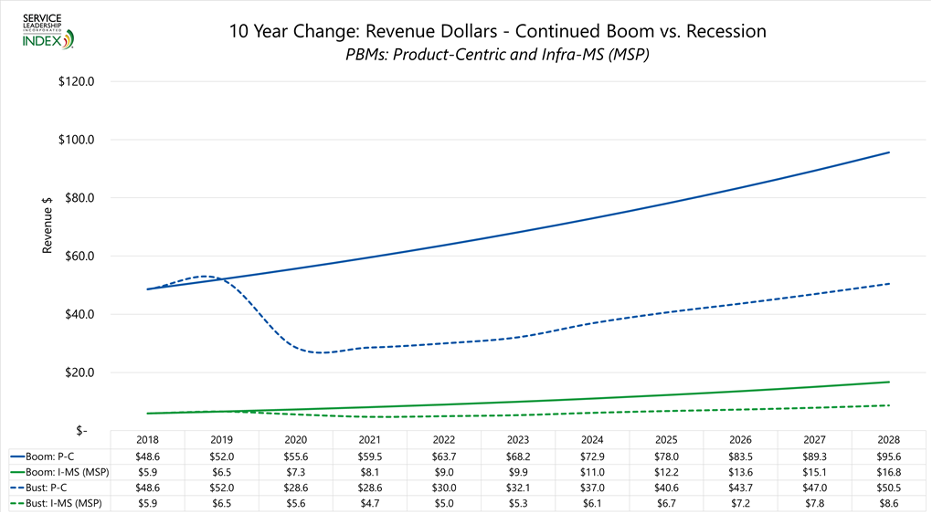
Figure 7 - Revenue of the average P-C and MSP firms, in a Scenario B recession (dotted lines)
The solid blue line shows what the Revenue of the average P-C firm ($48.6mm in 2018) would be in 2028 after 10 years of economic expansion (2019-28).
The dashed blue line shows the Revenue trajectory of that same average P-C firm since a recession has hit in 2020.
The green lines show the same for the average Infra-MS (MSP) firm, whose Revenue was $5.9mm in 2018.
In 2028 with no recession:
- The Median P-C firm would be $95.6mm. The average Infra-MS firm would be $16.8mm.
In 2028 with a recession:
- The Median P-C firm would be $50.5mm. The average Infra-MS firm would be $8.6mm.
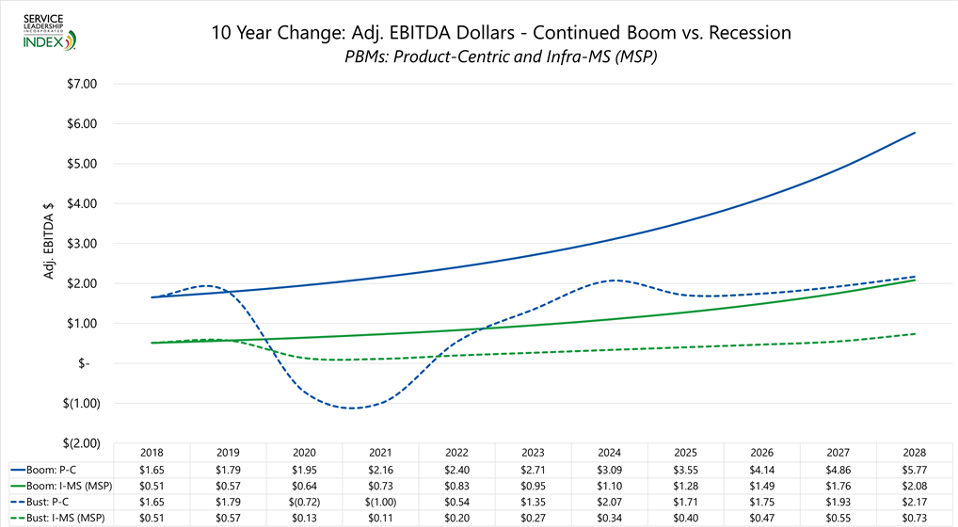
Figure 8 - Adjusted EBITDA dollars of the average P-C and MSP firms, in a Scenario B recession (dotted lines)
On this chart, we run the risk of creating “assumption-stacking errors” by applying the Median Adjusted EBITDA % Projections to the Median Revenue Change Projections. That said, the exercise merits coming to conclusions.
In 2028 with no recession:
- The Median P-C firm would deliver $5.77mm in Adjusted EBITDA. The average Infra-MS firm would deliver $2.08mm in Adjusted EBITDA.
In 2028 with recession:
- The Median P-C firm would deliver $2.17mm in Adjusted EBITDA. The average Infra-MS firm would deliver $0.73mm in Adjusted EBITDA.
A Last Word on These Projections
Projecting the future is a risky business, and we may very well be wrong. We hope, as we’re sure you do, that we are too pessimistic in our discussion today, but that you find our thought process useful in advancing yours.
Actions to Maximize Revenue, Profit and Safety
Most effectively navigating the turbulent waters ahead requires three steps:
- Understanding your likely today-to-nine months cash situation,
- Taking defensive steps to protect and bolster your firm so it is as safe and possible and can perhaps even make investments,
- Taking offensive steps to maximize the upside for your firm, this year and next.
We’re going to give you the details on these, but first, here are the strategies common to those Solution Providers in all business models who fare best in recessions.
Start-of-Recession Checklist of the Best-in-Class
As the recession starts to take hold, Best-in-Class management teams exhibit these behaviors:
- They cut costs quickly and deeply. Their peers will think they are over-reacting, but it is frequently the Solution Providers who cut costs hardest and soonest, that get hurt the least and recover the most quickly.
- Percentagewise, they cut G&A expenses the hardest, followed by the lower productivity performers in sales and service staff and management.
- They eliminate pay increases, but they retain incentives, albeit with smaller payouts and higher thresholds. They may possibly enact pay cuts, either selectively or across the board. In recession times, it is not unheard of for leaders to request the entire company take some degree of pay cut (usually a higher percentage for higher paid employees) with reductions in their own pay leading the way.
- They hoard cash.
- They renegotiate their vendor agreements.
- They watch their Accounts Receivable closely, account by account, and politely but crisply cut off customers who don’t pay or chronically late pay.
- They put extra emphasis on examining and acting on their Per Customer Profitability Report to drive up account profitability or at least minimize damage.
- They quickly come up with creative new solutions and services7, and go to market strategies and marketing campaigns which attract and address the three top concerns of decision-makers: cutting cost, reducing risk and driving Revenue.
- Once these are ready, if any budget item is increased, it is spending on demand generation. The Best-in-Class invest more, sooner, in marketing and selling in the face of a recession than do the lower performers.
- The leadership gets out in front of employees, customers and prospects more frequently and visibly.
If you get nothing more from this newsletter, pay attention to this checklist.
Understanding Your Likely Today-to-Nine Months Cash Situation
Unfortunately, it looks like, because of the steep drop in Revenue that many of your customers are going to experience, it is likely that you, too, will experience a rapid reduction in Revenue generation, and therefore profit dollars.8
In the face of this, you must quickly determine three things as best you can:
- What your likely Revenue reduction will be,
- What your likely reduction in Gross Margin dollars will be (because you can only pay expenses with Gross Margin dollars, not Revenue dollars),
- How much cash you will likely have on hand to pay the bills.
These together will help you understand the degree of safety you do or do not have, and the speed, depth and nature of the actions you must take.
A True-Life Example, and Our Response
The spreadsheet below shows an example of one Solution Provider’s actual calculation of their February 2020 Balance Sheet and Income Statement (labeled Case 1) in a format we provided them, and then our response to it (Case 2).
Those of you who subscribe to our S-L Index benchmarking or have implemented our Normalized Solution Provider Chart of Accounts™ (NSPCoA™)9, will recognize the row labels as being set to that standard. Those of you who do not, you can likely interpolate quickly to your own Chart of Accounts.
Column D: In both examples, column D, labeled “Today” is this Solution Provider’s:
- Income Statement from their most recent month (February in this case),
- Their Balance Sheet as of the day they put this spreadsheet together (March 19, in this case).
This is because the most accurate Balance Sheet can be pulled daily, while the most accurate Income Statement is last month’s. This is close enough for our purposes.
Column E: In both examples, column E is the percent by which they (in Case 1) and we (in Case 2) are adjusting the value in column D for the risk presented by the current economic situation. A positive value in column E, means a reduction of the value column D by that amount. Thus, a column E value of 40% means the value in column D will be reduced by 40%: $100 in column D x (less) 40% in column E = $60 = column F.10
Column F: This is the risk-adjusted number.
As noted in the title of this subsection, the objective here is to determine how long the company’s liquid assets (essentially cash on hand and collectable Accounts Receivable) can pay for the company’s essential expenses (payroll and other unavoidable fixed expenses).
The assumption here (as discussed in the second section of this newsletter) is that the Revenue of virtually all Solution Providers (MSPs, VARs, and other business models alike) will materially decline in the near term, and probably for some period of time.
The follow-on assumption is that many Solution Providers will go into negative cash flow, that is, will start to lose money, possibly as soon as this month.
It is imperative that you know, with reasonable accuracy,
whether or not this is true for your company, as soon as possible.
Once you have determined that you are likely to be losing money (though we hope not), it is also imperative that you know how many months of cash coverage you have under these conditions.
How many months will your available cash cover the bottom-line losses, if Revenue continues at a depressed level, continues to decline or, improbably but these days possibly, stops altogether?
That is the purpose of this subsection.
To orient you to the more detailed spreadsheet of our examples, let’s first look at a simple version, shown in Figure 9, below.
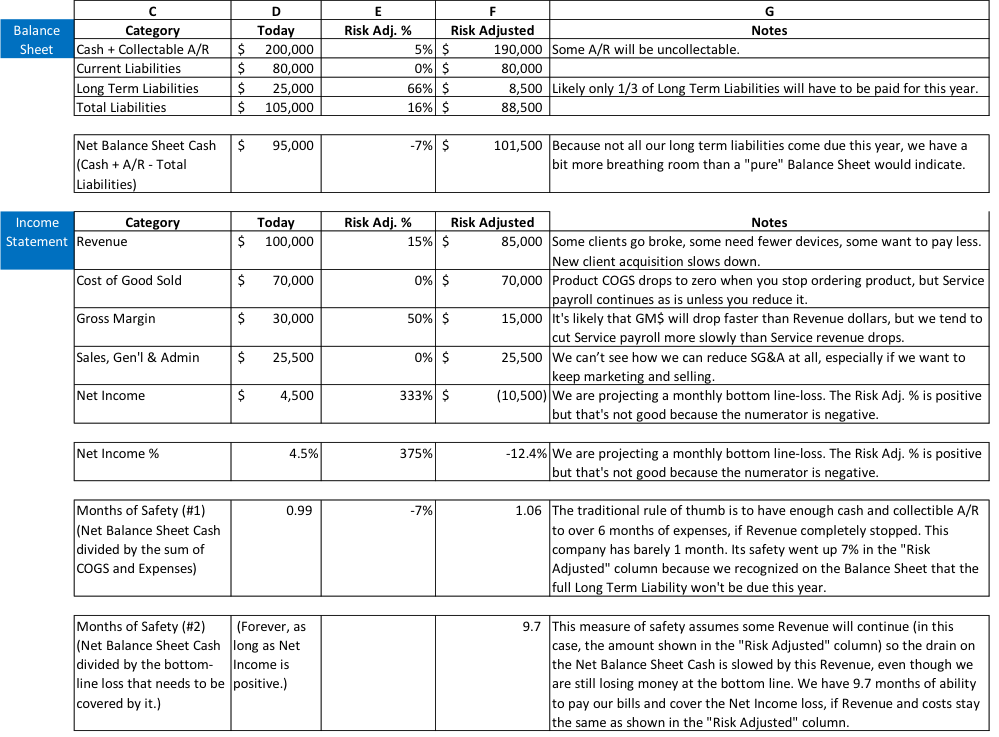
Figure 9 - Simple version of a risk-adjusted "Months of Cash" calculation
The above example is fairly merciful: even though the bottom line goes negative, there’s enough cash on hand after our likely liabilities and expenses, to cover those losses for 9.7 months, as long as the risk-adjusted level of Revenue keeps coming in and our costs stay where they are.
As stressful as running nine months of losses would be to this fictional management team, in real life, unfortunately, things are often not even as easy as this.
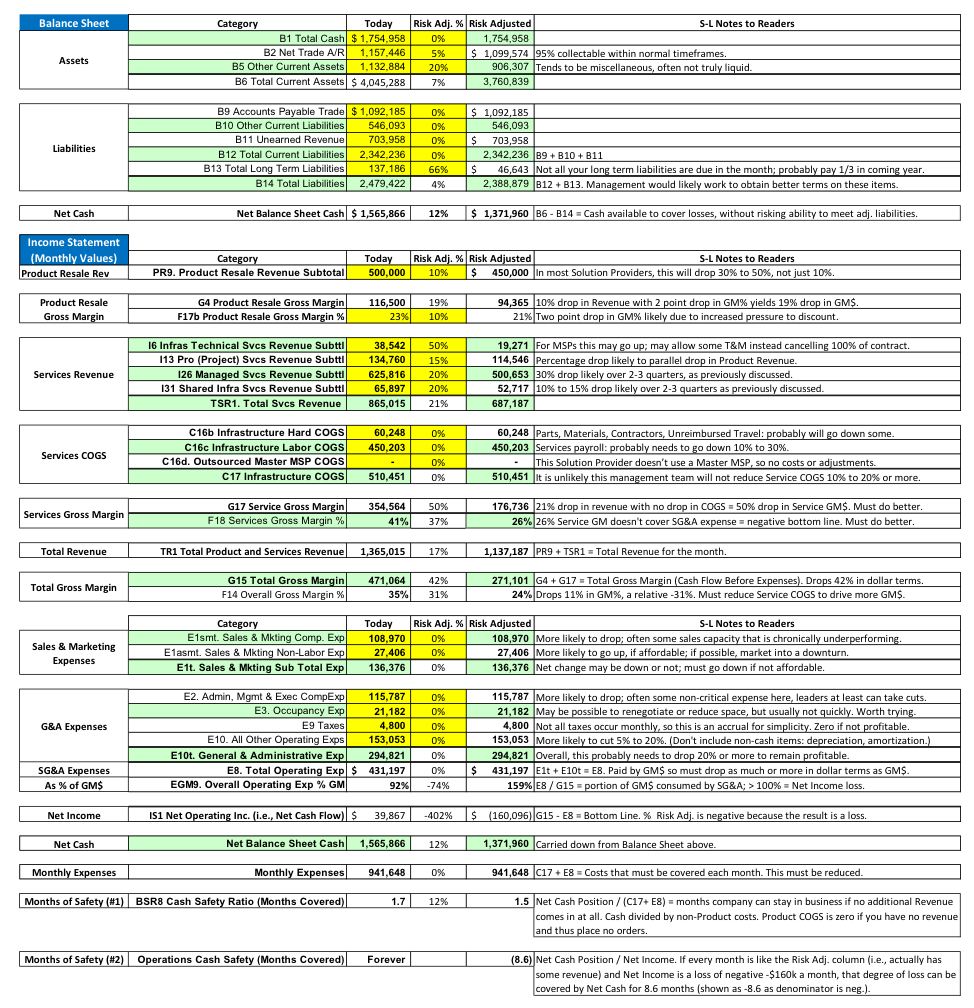
Figure 10 below shows the initial attempt by an actual Solution Provider management team, to perform the risk-adjusted “Months of Cash” calculation.
In the column titled “S-L Notes to Readers” we provide the comments we gave as we advised them on revising the spreadsheet to better reflect the likely situation and restore bottom line profit under those conditions.
(Please forgive the tiny font; a larger version of this is provided in the Appendix, in landscape format.)
Case 1: Created by Solution Provider

Figure 10 – Initial attempt by a real Solution Provider to create a risk-adjusted “Months of Cash #2” calculation
In the second to last row, “Months of Safety #1”, we see that this management team calculated that, prior to the downturn, they had enough cash and collectable A/R to cover 1.7 months’ worth of Service Payroll and SG&A costs if no further Revenue came in the door. They further calculated that, after the downturn, despite now losing -$160,000 at the bottom line, they still had 1.5 months of cash coverage without any future Revenue.
In the last row, “Months of Safety #2”, we see that they calculated, before the downturn, because they were generating positive Net Income, they essentially had cash to last forever (as long as those conditions persisted).
We see that they calculated the post-downturn “Months of Safety #2” at 8.6 months. This may be enough time for a recovery to start to take hold and a return to a positive bottom line for the Solution Provider.
Wisely, they were anxious about suddenly losing -$160,000 a month and about what had appeared to be a seemingly reassuring calculation that they could withstand that loss for nearly nine months.
As they reviewed this with us, we saw right away that these conclusions were, indeed, likely to be false. As you can see from our comments in the “S-L Notes to Readers” column, our suggestions to them were to instead assume:
- Balance Sheet
- A lower proportion of A/R actually being collectable,
- Income Statement
- Revenue
- A greater drop in Product Resale Revenue,
- A rise in T&M Services Revenue as some clients shift from Managed Services to T&M,
- A greater drop in Project Services Revenue,
- A greater drop in Managed Services Revenue,
- A lesser drop in Private Cloud Revenue,
- Cost of Goods Sold
- Their zero decline in Services payroll was unrealistic,
- Expenses
- Their zero decline in SG&A expenses was unrealistic,
- Net Income
- Their negative -$160,000 bottom line was probably unrealistically optimistic.
- Months of Safety #2
- Thus, their actual Months of Safety #2 was probably much less.
In recessionary times, when Revenue is going to decline from current levels, the wise management team:
- Does not “play chicken” with its cash reserves and the future economy by running a negative bottom line,
- Does rapidly adjusts costs to ensure a positive bottom line given the reduced Revenue, and then throws its efforts into keeping existing business and winning new business.
The age-old wisdom applies: “Prove the profit model, then grow.”
This is because plans to return to profitability by growing most often do not come to fruition. Most often, unfortunately, either the hoped-for growth doesn’t come soon enough and/or expense ratios do not improve as Revenue rises. No, the winning move is to reduce costs, generally across the board. Better to ensure saving some value in the company and some jobs, than to risk losing all.
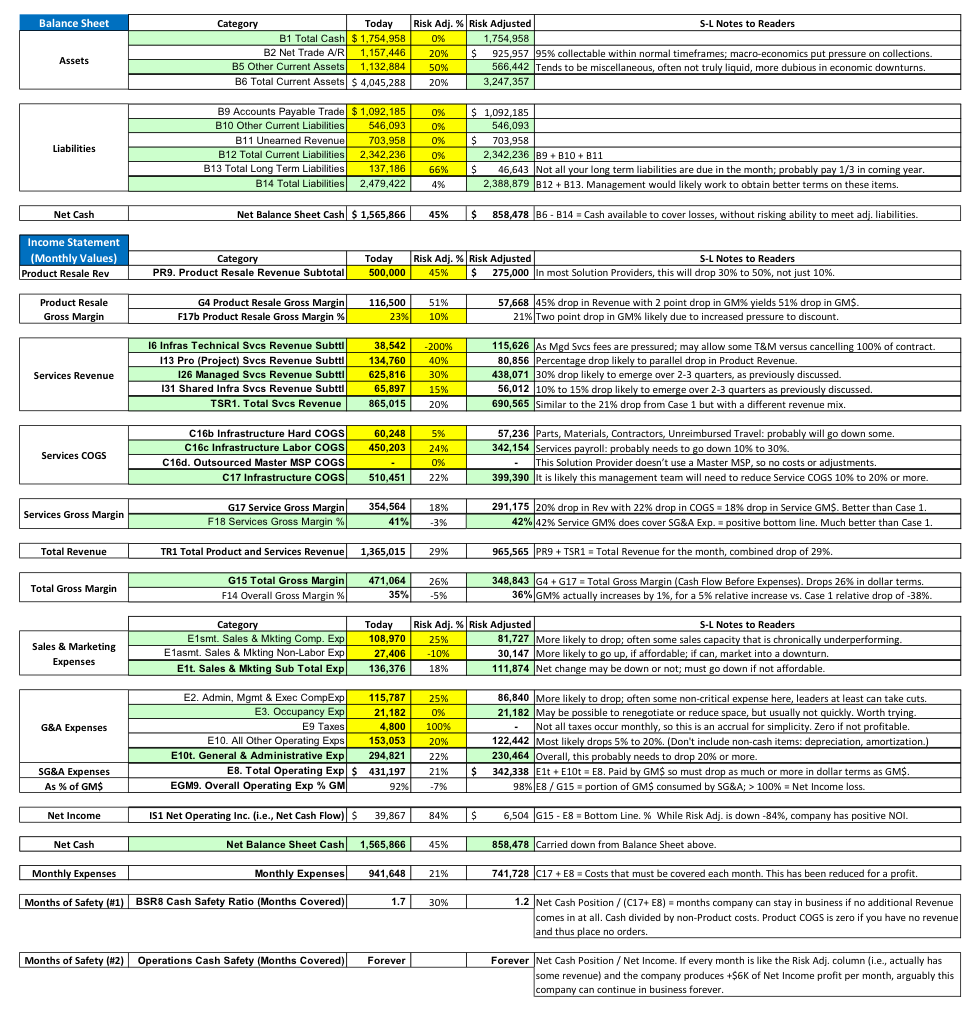
Figure 11 shows the revised “Months of Safety #2” suggestions which bring the company immediately to profitability, albeit by a thin margin.
Case 2: Service Leadership’s Revision
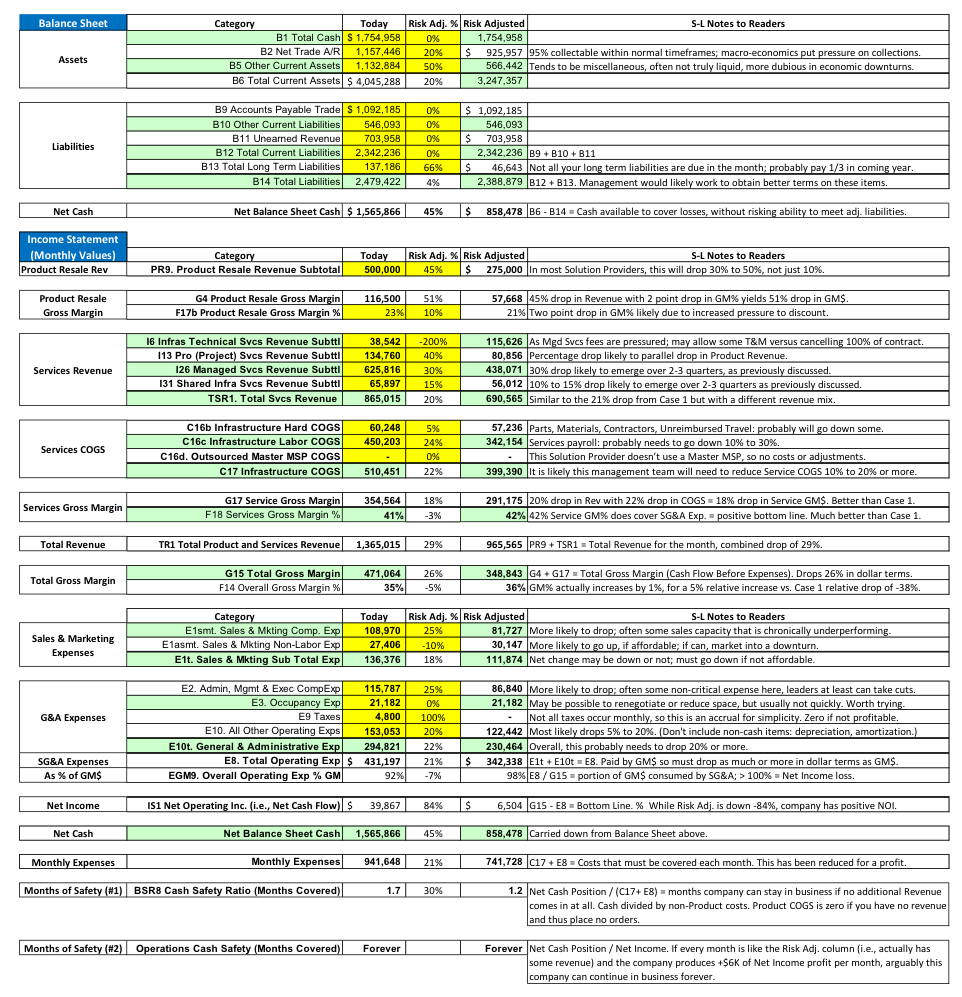
Figure 11 - Revised risk-adjusted "Months of Safety #2" calculation with suggested assumptions
You can read our suggestions in the “Notes to S-L Readers” column and as described above.
Their primary challenge will be to reduce payroll in Services, Sales and Marketing and General and Administration, by 25%.
Compared to many types of businesses, Solution Providers have a large proportion of their total cost in employees – people. As a result, while in good-to-great times, we can employ many people and often have a hard time filling new positions, in recessions we cannot have as many people, and positions are often easier to fill. Thus, it is to payroll – people – that we must turn to reduce costs to a survivable level.
As we discussed earlier in more detail, understandably, Solution Provider owners and executives are reluctant to terminate employees. At a high level, here are our suggestions for how to do so, for this company:
- Have fewer individual contributors and/or managers,
- Have the same number do an across-the-board pay cut and hope most or all stay,
- Change out costlier people for cheaper ones with sufficient skill,
- Change out two cheaper people with one more costly one (whose pay is less than the sum of the two they replaced).
How easy will it be for them to reduce payroll by 25% in each department? Based on the Revenue mix of this Solution Provider, we know their PBM is Infrastructure-Technical Services, and their February Net Income of 2.8% ($39k on Revenue of $13.65mm) puts them squarely on average performance for that PBM.
To address the greatest proportion of our reading audience, we’re going to look at the Service Leadership Index cost ratios of the Median Product-Centric (not Infra-Technical Services) firm and the Best-in-Class ones, to get a sense for this company’s opportunity to improve.
| 2019 Cost Factor |
Median |
Best-in-Class |
Median Is |
| Services Gross Margin % |
27.4% |
44.2% |
Lower by 38.0% |
| Sales & Marketing % of Rev |
7.2% |
5.3% |
Higher by 35.8% |
| General & Admin % of Rev |
11.1% |
13.9% |
Lower by 20.1% |
Services Gross Margin %: As we can see, the Median firm in this PBM has a Services Gross Margin % that is 38% lower than that of the Best-in-Class. This means that their Services COGS (1 – 27.4% = 72.6%) is 30% higher per Service dollar than Best-in-Class (1 – 44.2% = 55.8%). As a result, leaving potential factors such as geographic coverage, maintaining vendor certifications, efficiency and quality of delivery and utilization management, the average firm could cut their Service payroll by about 23% (that is, right in line with the 25% reduction the spreadsheet requires) and have about the same payroll cost as the Best-in-Class in their business model.
The factors we “left aside” are real, but they often become more attainable, if no less unpleasant, when faced with losses at the bottom line.
Sales and Marketing Cost: As we can see, the Median firm in this PBM has Sales and Marketing cost as a percent of Revenue % of about 35% more that of the Best-in-Class. That means that they could cut 35% of their Sales and Marketing payroll and have about the same payroll cost as the Best-in-Class in their PBM. In both Median and Bottom-Quartile Product-Centric firms, there is often quite a bit of low productivity sales cost. This is now both the bad news (it exists) and good news (it can be reduced with limited negative impact on the firm).
General and Administrative Cost: As we can see, the average firm in this PBM has General and Administrative cost as a percent of Revenue that is 20.1% lower than that of the Best-in-Class. Meaning, they would have to add payroll to this team to get to the Best-in-Class number. This is true of the average Product-Centric firm: their overall Gross Margin is so thin that they attain profitability partly by under-funding General and Administrative costs in comparison to the Best-in-Class, who have materially higher overall Gross Margin. Obviously, in today’s situation we do not want to increase payroll in this area.
For the benefit of our readers who are MSPs, here are the same cost ratios for the Infra-MS (MSP) Predominant Business Model:
| 2019 Cost Factor |
Median |
Best-in-Class |
Median Is |
| Services Gross Margin % |
44.7% |
51.8% |
Lower by 13.7% |
| Sales & Marketing % of Rev |
6.5% |
5.1% |
Higher by 27.5% |
| General & Admin % of Rev |
23.1% |
21.8% |
Higher by 6.0% |
The performance ratios are different from Product-Centric, but the method for bringing them in line is the same.
If there is a sense that we are perhaps “brushing away” real world challenges of cutting headcount to arrive at a number, the fact is, in restoring a company to profitability, this is the end of the management decision-making spectrum that you need to err on. You need to be thoughtful, but as leaders, if you are to save the most shareholder value and the most jobs, you need to “face the pain” and go through it. The sooner and more complete, the less painful and the sooner you can create safety for the shareholders, the remaining employees and your customers.
In the case of our real-life Solution Provider, we need to get to a 25% reduction in total payroll. The spreadsheet has us doing this by cutting 25% in each department, but if we look at their Income Statement (and not that of the Median P-C firm) where are the opportunities to do so?
| Cost Factor |
Our Solution Provider |
Best-in-Class |
Our SP Is |
| Services Gross Margin % |
41.0% |
44.2% |
Lower by 7.2% |
| Sales & Marketing % of Rev |
9.9% |
5.3% |
Higher by 88.5% |
| General & Admin % of Rev |
21.5% |
13.9% |
Higher by 55.0% |
As it happens, this firm, although Median in profit performance, actually runs a Services group which nearly attains Best-in-Class Gross Margin (for Product-Centric firms). There is only a 7% cost opportunity in this department.11 Do we need to take it?
Perhaps not, since the costs in Sales and Marketing are 88% high and the costs in General & Administrative are 55% high. Can such reductions in these two departments meeting our overall goal of 25%?
From their S-L Index benchmarking, we know that in Q4-19, this firm had:
- 71 people in Service,
- 4 people in Sales,
- 3 people in General & Administrative.
Without going into the payroll cost detail, we can see from the headcount numbers that the SG&A departments cannot be cut much at all. Which means that the majority of cost must be taken out of the Service department.
If Service is running at almost Best-in-Class labor efficiency (though, see footnote below), why do we need to look there for reduced costs? Unfortunately, it’s this simple:
- Since our model presumes that customers will reduce their purchases of Product by 45%, and the remaining Product will be sold at slightly lower Gross Margin %, the flow of GM$ from Product drops by 51%.
- That makes our current level of spending on SG&A expenses materially too high for our likely Gross Margin production. And since those two groups have a total of seven people, they can’t be materially cut, while the Service group has ten times more people, that must be where we look for at least some savings – the 7% we identified above or perhaps a bit more. We certainly don’t want to compromise Services Revenue.
If we cannot trim headcount enough to meet our goal of 25% payroll cost reduction, what are our options? Probably we are looking at pay cuts, possibly eliminating incentives, but more likely reducing overall compensation packages. Generally, management is in a better position to absorb these reductions than is staff, but in this case, all will probably need some level of sacrifice.
There are some cost components in all three departments that are not headcount-related, and these should be examined and reduced as much as possible. But because most of Solution Provider firms’ cost is in payroll, unfortunately this is where we usually end up turning when Gross Margin is severely lacking.
Of course, we can and should try to sell our way to generating more Gross Margin – more on this in a moment – but we know the Best-in-Class in these situations count on cost reductions first because it’s safer.
The same approach must be taken with every cost line in the company; the spreadsheet tells us we are dealing with a 26% drop in total Gross Margin dollars, and we must get to bottom line profitability.
We’ll make one last note about our real-life Solution Providers’ mid-epidemic Income Statement. The sharp-eyed reader will have noticed that we pared costs enough to increase our marketing budget by 25%. To the extent customers and prospects are spending money, we want them to know about us!
A Deeper Dive on Guesstimating Your Near-term Revenue Numbers
Before we move on to driving Revenue in a downturn, it will be helpful to take a deeper look at how to safely guesstimate your near-term Revenue numbers by using a quick spreadsheet we created for another Solution Provider, this one a $25mm MSP.
Figure 12, below, shows the spreadsheet that we quickly worked up in a 50-minute phone call.
They had not had time to put much thought into what any client other than their largest – which they had budgeted to contribute nearly 10% of their Revenue in 2020 – would cut in the downturn. This particular client is in Hospitality (hotels), a sector which we already know is being badly hurt.
The executives of that client informed the Solution Provider of their intent to cut really all of their planned 2020 Product purchases. That is recognized on the spreadsheet as a large part of the $1.5mm drop in Product Resale Revenue.
During our call:
- The Solution Provider had not yet contemplated the reduction in Project Services caused by this $1.5mm non-sales of product, so we first took $209,000 out of Infrastructure Services Revenue.
- We then listed their top nine clients, including the #1 client already partially accounted for, and for six of them, reduced their Annual Recurring Revenue for the remainder of the year. The Solution Provider is confident the remaining four will not cut staff (and therefore not cut per-user fees) or ask for any other form of discount. We believe this is unlikely, but the point of the call was to help the Solution Provider get started with a more realistic picture of the key elements in their planning process.
- Together, we made estimates of how much new Services business they would not win, and how much all the other Managed Services clients might reduce their Managed and Project Services fees.
In total, we estimated that Product Resale would drop about $1.5mm and Services would drop about $955,000 from their 2020 budgeted numbers.
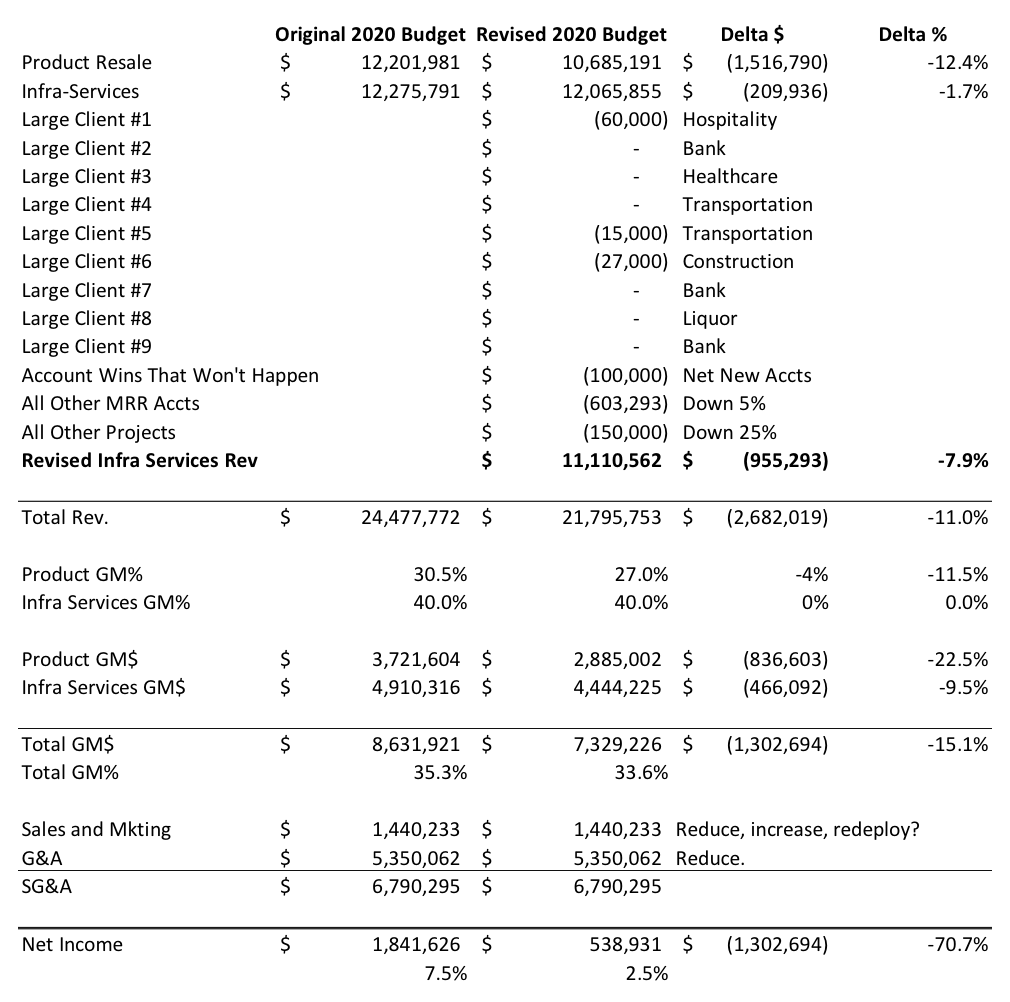
Figure 12 - Quick "Before and After" Income Statement with Per-Client Revenue Risk Adjustment Detail
Further, we reduced their Product GM% from 30.5% to 27.0% to account for likely discount pressure. We kept the Services Gross Margin at 40%. However, since this was on $955,000 less Revenue, clearly, Services costs would need to be cut a proportionate amount to maintain that 40% GM, which of course would then produce 9.5% fewer Gross Margin dollars.
The management team of this firm is quite capable, and maintaining 40% Services GM may well be possible, if difficult.
Overall, we quickly projected a 15.1% decrease in Gross Margin dollars for the year, as compared to their budget. For lack of time on the call, we didn’t get to guesstimating reductions in Sales, Marketing, General & Administrative costs, and so they remain as they were in their budget. The CEO was relieved that the bottom line had only dropped from 7.5% to 2.5% (though obviously concerned that Net Income dollars will drop by about 71%).
Unfortunately, despite this apparent “good” news, we believe that Revenue will be impacted to a greater degree than shown here, and reductions in SG&A cost will be required to still deliver a bottom-line profit.
Be that as it may, in 50 minutes we were able to provide a revised planning framework which will be useful to this team in short order.
The Cash on Hand Status of Solution Providers as of the Start of Q1-20
In normal (good to great) economic times, the traditional rule of thumb of having six months of cash to cover all your expenses assuming 100% of Revenue stops, seems rather old fashioned and unlikely to be ever needed.
In “normal” recession times, it still seems somewhat overly-conservative – surely 100% of Revenue will not stop, so to speak, on a dime.
Yet, in the case of this epidemic, it unfortunately seems like we might get as close to that doomsday scenario as we might ever see in our lifetimes.
Retaining and Driving Revenue in a Downturn
Let’s now turn to a more pleasant – if equally challenging – subject: Keeping as much of your current Revenue as possible and driving new Revenue.
What do we know about the selling environment? We know:
- The more operationally mature of your clients’ and prospects’ management teams are doing the same planning for their companies that we are doing here.
- You must deduce which of your clients are higher and lower in operational maturity, so that you can most safely gauge their requests and responses to you. Lower maturity clients will not provide useful planning information.
- Clients and prospects are vitally concerned with rapidly reducing cost, reducing risk and driving Revenue. Offerings which address these objectives will be prioritized highly by them.
- Most often, the reality of the situation and/or their shareholders will be mandating deep cuts in spending in every category including IT capital and operating expenses – we can assume cuts of 10% to 30% although it may well be more.
- We can assume their need for IT products and services will not decline, but instead probably change and possibly go up. Their ability to pay for these is what will diminish.
- Obviously, new solutions and services which enable them to drive Revenue and service customers, will be further prioritized.
We can already see changes in customer buying patterns, and in likely requirements:
- Risk Reduction
- The cyber-security of most employees working from home is substantially lower than when they are working from their offices – the “threat surface” at home is materially greater. Managed Services must be re-tooled to deliver security; those that do will lose fewer clients and gain more.
- Drive Revenue
- As most of your client’s people work from home – serving their own customers and pursuing their own prospects – their use of remote access and collaboration tools is skyrocketing. Managed Services must be re-tooled to support these workloads; those that do will lose fewer clients and gain more.
- A large school district quickly cancelled orders for a long-standing, contracted major project that was in progress, and instead placed a rush order for a large quantity of tablets complete with configuration, delivery, security and support services, to enable students to study from home.
- A large technology vendor’s inside sales force of 3,000 people was immediately shifted from call centers to Work From Home, only to find that in the call centers they used only desktops. Thus, a rush order for 3,000 laptops was placed, again with configuration, delivery, security and support services.
Small and mid-sized customers will exhibit the same changes in buying behavior and requirements.
Downturns Can Drive Managed Services and “Conquest” Sales
In Enterprise and Mid-Market customers, where management more often (though not always) has professional management experience, outsourcing more – including outsourcing IT – is a well-accepted survival tactic during downturns.
Outsourcing allows them to shift the burden of execution to the provider, so the client can focus on their core business. It also allows them to shift the financial risk of meeting uncertain and probably variable, IT support consumption levels to the provider.
It remains to be seen how many small-business decision-makers will come to the same conclusion.
In addition, prospects who currently have Solution Provider relationships will, more often than usual, find their current provider to be unable to meet their needs, either because their needs have changed, or because the provider is struggling financially. They will search for a new provider, giving you the opportunity for a “conquest” sale.
Strategies for Retaining and Growing Revenue, by Predominant Business Model
From our 2019 Annual Solution Provider Industry Profitability Report, here are our summary recommendations for driving Revenue (as well as managing other factors) during a recession. Where appropriate, they are segmented by PBM.
Strategy
Area |
Product
Centric
(P-C) |
T&M-Centric (Infra-TS) |
Project Services-
Centric
(Infra-PS) |
Infra-MS
(MSPs) |
Infra-SS (private
Cloud-
Centric) |
A-PS
(AppDev-
Centric) |
| Finance |
Have cash in the bank to cover all expenses for 3-6 months. Be prepared for employees to have personal financial difficulties, and for an upsurge in client slow-pays and no-pays. Tighten collections and shorten DSO. Crank up your credit-checking before taking on a new customer or significant deal. In exchange for discounts, collect more up front. Secure your line of credit and understand your covenants. Delay all but essential capital investment and expense commitments. Reduce incentive pay by half or more (except for Sales), but do not cut base pay unless critical. Keep Sales’ incentives and consider boosting but be sure to drop low productivity reps from payroll. Cut R&D and “science projects” exploring or developing new offerings. |
| Staffing |
Cut staffing levels hard across the board. Those who do, fare best in terms of morale and retention of best employees and customers. Those who are more timid then must perform multiple cuts which do greater damage to morale and customer relationships. Only keep those you would hire again if you were starting a new company. Your smartest employees and customers will be watching for bold decisions. |
| |
Keep pre-sales and make billable (dual purpose). See text at right, also. |
Focus on keeping your high performers at all skill levels, with special emphasis on keeping the high performers who are lower skilled and at lower wages. These will save your company. Only keep higher skilled (more costly) technical people if they are good at getting new business and at being billable themselves. |
| Offerings |
Focus on the lower-cost end of your current chosen vendors’ wares. Pick a single, cheaper second vendor for each part of your tech stack. Don’t skimp on project budgets; cutting corners costs more. Block time for Service, works. If MS isn’t profitable, don’t add or expand contracts. |
You will win some customers coming off of MSP contracts. Keep billable rate at 2.5 x Taxable Wages of your techs. Sell block time which states you will proactively burn it on preventative maintenance and management. |
Assume fewer and smaller contracts, especially at first. Later in recession, downsized clients will outsource more projects. Don’t skimp on project budgets; cutting corners costs more. Block time works. If MS isn’t profitable, don’t add or expand contracts. |
Do not negotiate different recession deals with each client.
Create a single “recession special” or “deferred maintenance” package at about 70% of your current SLA and price, with on-site and projects billed via block time.
Hold or increase GM%, even though lower dollars.
Write terms that automatically retire the “deferred maintenance” package and restore the pre-recession one after 1 year, but be prepared to wait 2 years. |
Assume fewer and smaller contracts, especially at first. Later in recession, downsized clients will outsource more projects. Don’t skimp on project budgets; cutting corners costs more. Agile works. |
Figure 13 - Recommendations for driving Revenue in a recession, by business model.
| Strategy Area |
All Predominant Business Models |
| Clients |
Grade existing clients as follows: “A” = on your tech stack, your fullest offer and your best win/win pricing, “B” = close on all, “C” = not close but GM% exceeds your SG&A %, “D” = not close and GM% doesn’t exceed your SG&A %. Actions: “A” = keep, “B” = raise to “A” when possible, “C” = keep but try to get more in line and act on them when D’s are all gone, “D” = terminate when you win a new “A” or “B”, or right away if really hemorrhaging. |
| Marketing |
Focus hard on messaging that you enable your clients to: manage costs and risks, drive new Revenue, keep their own customers happy. With some of the savings from other cuts, judiciously increase marketing spend, especially Thought Leadership Marketing (C-level speaking, publishing); become the locally recognized expert on saving money, driving Revenue and keeping customers happy using great IT. Also focus on maintaining and extending the value of the customers current IT assets, as opposed to only promoting acquiring new assets. Those who market effectively into the face of a downturn, do better soonest, but make sure each marketing strategy produces results early, otherwise cut and spend on other ones. |
| Sales |
CEOs: Get out and meet most important existing customers and especially new prospects, a lot. Lead by example. CFOs or Finance execs: Get out and meet all the other existing customers. Sales management: Create a “war-room” atmosphere and nurture every material opportunity. Learn to pre-qualify more accurately and get management and/or pre-sales on phone calls sooner with pre-qualified; if the phone call goes well, get them out face-to-face with the prospects sooner, too. Assume some of your competition will fall apart, so keep an eye on their best accounts and best Salespeople. Make clear that losses of deals or accounts, are due to client/prospect not fitting your needs and/or going out of business. Celebrate wins and renewals loudly. Cut your bottom 30% of Sales reps; move their accounts to productive existing reps. Pay your best hunters to hunt more and shift their existing accounts to lower cost farmers. |
| Service |
Make sure account losses are due to clients’ business difficulties, not your service levels. Highlight great customer service and lead generation by Service people, especially your lower cost people. Highlight examples of good Sales/Service collaboration. Cut 15% to 30% of your most costly people and shift their work to remaining folks. Reassure Service people – who are analytic types and therefore perhaps tend to be overly pessimistic – that recessions do end and that the company has reserves and is executing its plan. Fewer busier people will thrive sooner and are easier to manage than more, less busy people. |
Figure 14 - Recommendations for driving Revenue in a recession, for all business models
Some additional detail for Product-Centric firms:
- Renegotiate vendor contracts for better pricing and terms.
- Consider the secondary market and sell refurbished equipment from secondary resellers.
- Consider taking in used equipment to be refurbished, to help finance new purchases.
- Find options to enable clients to finance capital purchases.
- Find lower-cost replacements for higher-cost product lines. Identify solutions that can be implemented and supported with fewer billable hours and/or lower cost skills (yours or your client’s).
Together these actions can help mitigate Revenue attrition and secure client relationships, helping to sustain profitability and promoting a more rapid recovery.
Some additional details for Managed Services Providers:
- Immediately come up with a “second standard” package, approximately in between what your long-abandoned bronze and silver packages contained. It needs to contain the bare minimum that you now know is necessary to keep things running and protected; this is more than you thought the bare minimum was five years ago when you were OML 3 or below.
- Price it at 50% Gross Margin. This will probably put you at 25% to 35% lower in price – and therefore 25% to 35% lower in Gross Margin dollars – than your current standard (fully managed) offering.
- Label it “Emergency Coverage” or “Deferred Maintenance” or a similar name that purposefully conveys temporariness.
- Unless the recession gets really nasty, do not proactively offer it to existing clients.
- However, do not negotiate individual “slimmed down” deals with existing (or new clients) who request it. You cannot end up with an array of custom deals, which will crush scalability, quality, profit and retention. Instead, you must move everyone who wants less than the full meal deal, to the “second standard.”
- As implied by the labels above, you want to communicate right from the start that this lower cost offering really is sustainable only for a short period of time, that relying on it for too long creates unacceptable risks or degradations in productivity, customer service, security and privacy, IT planning, and so on. Analogies you can use are: “How long in the recession can you put your home, your building, your factory floor, your fleet, on minimal maintenance before you have risked too much?”
- As you negotiate moving the client to the “second standard” package, if you can, negotiate the terms and timing under which you will return to your previous scope, SLA and pricing.
Are There Vertical Markets That Are More or Less Recession-Resistant?
The question often comes up, “Are there better and worse vertical markets to be in, during a downturn?
The answer is, “Yes, sort of.”
There are two factors here:
- As we will note, some verticals do fare better than others during recessions, and thus their Solution Providers may have an easier time.
- That said – importantly – those Solution Providers who are already successfully vertically-focused, almost always do better by staying focused on that vertical even if it is a lower-performing one, than trying to switch or add a vertical.
Why is the second bullet true? Because those Solution Providers who are successfully vertically focused, have the vertical knowledge to most compellingly convince decision-makers they can help them drive Revenue, reduce cost and reduce risk.
These Solution Providers tend to take market share – such market as there is – from the generalist Solution Providers who currently serve them. They are also more likely to be compelling when approaching prospects who, prior to the downturn, had their own IT departments but who now wish to instead outsource.
That does not necessarily mean, for a vertically focused Solution Provider who is short on Gross Margin dollars, that they should not take on a willing new customer in another vertical, if survival mandates it.
Here is a short list of verticals who tend to stay better, or worse, in recessions. Remember, these are broad statements, not guarantees.
- Better (not decline as much or possibly grow):
- Healthcare,
- Law firms (especially those focused on bankruptcy),
- Some government and quasi-government entities such as utilities,
- Banks (until they go out of business),
- Manufacturing segments focused on economy-minded products and on repair parts,
- Services focused on maintenance and repair,
- Low cost entertainment.
- Worse (decline more):
- Construction,
- Real estate,
- Financial management,
- Luxury goods and services,
- Many forms of transportation,
- Hospitality and restaurants,
- Many non-profits.
No doubt there will be exceptions to these.
Mergers and Acquisitions in Downturns
To try to anticipate what Mergers & Acquisition (M&A) might do during this downturn, let’s first recap our planning scenarios:
- A “V” shaped recovery – meaning a short, sharp, shock and then back up to something like full steam by Q4.
- A “U” shaped recovery – more like 18-36 months to the beginning of substantive recovery.
- An “all bets are off” extended economic disaster of unknown duration and depth but worse than #2 above.
As previously noted, we are hoping for Scenario A and planning for Scenario B.
How would M&A activity, pricing and terms change in each of those?
Clearly, M&A is pausing right now. Everyone is too busy trying to implement the most effective, most stable form of operations and ascertain which customers are going to be able to pay.
To the extent Buyers might have time to consider transactions, and Sellers might have time to contemplate them, what we’re seeing so far is “same price, terms more favorable to Buyer”, meaning, the re-appearance of earn-outs. Possibly heavy ones: 50% of the valuation tied to an earn-out for example, where a week before, the Buyer wasn’t requiring any earn-out. Will the Seller accept? Who knows?
This will perhaps apply for the next few weeks or months.
From there, those Solution Providers with the most robust financials, most determined management teams, largest sources of funding, least-impacted work forces and who have the most customers who have these attributes, will do the best.
Those who lack one or more of those attributes, are going to suffer more. Probably there will be an increasing number of distressed companies up for sale.
As we know, the party with the least time pressure, has the upper hand in any negotiation. To the extent that there are Buyers – and with the Private Equity groups in the arena, likely there will be – then one presumes that deals will get done, on prices and terms more favorable to the Buyer. They would be more favorable to the Buyer because:
- More companies on the market,
- More of those companies would be distressed sales, meaning lower performance and less time to reach a deal,
- Fewer Buyers, meaning fewer of the non-private equity Buyers that have been in the market.
Assuming the Buyers would want to buy, this would imply lower prices and more contingent earn-outs.
What happens next depends on which economic scenario we are looking at: “V-shaped”, “U-shaped”, or “all bets are off”.
| Scenario |
Deal Price and Terms
– Until Recovery |
Deal Prices and Terms
– During Recovery |
Deal Volume |
| “V” Shaped Recovery |
Moderate Shift in Both, Towards Buyer |
Rapid Rebound, Probably to Pre-COVID-19 Levels |
“Pause” then quick to very quick recovery. |
| “U” Shaped Recovery |
Heavy Shift in Both, Towards Buyer |
Slow Rebound, Possibly to Pre- COVID-19 Levels |
Flurry of Distressed Sales, Then Lower Volume as Stronger Potential Sellers Hold Out for Better Pricing/Terms |
| “All Bets Are Off” Recovery |
Heavy Shift in Both, Towards Buyer |
Slower Rebound, Perhaps Not to Pre- COVID-19 Levels |
Long Cadence of Distressed Sales with Volume Mounting, Few Prime Assets on Market |
It’s an unfortunate situation, to be sure. To the extent that one might have viewed the participation of Private Equity in the market as a negative thing (we do not), certainly now their presence in the community has to be seen as a good thing – they may make up the largest population of Buyers for willing Sellers.
Even among Private Equity groups, many will be less aggressive Buyers during this time. This may be because they lack funds and borrowing power, because they’re focused on making sure their current portfolio companies survive (or are selling them), or because their strategy has them backing off during recessions.
However, there will no doubt be Private Equity groups – and other private and public Buyers – whose approach is to be more aggressive during downturns.
Closing Advice to Those Charged with Leading Through These Times
As you no doubt know, leaders have successfully led through adversity, throughout the course of human history. The same will be true during these challenging times.
There is no lack leadership advice available; we urge you to seek out that which resonates most with you.
However, if we may offer in closing, these suggestions:
- Lead by example.
- Over-communicate. In absence of communication, people will tend to assume the worst, so communicate, communicate, communicate.
- Remember, people – even if they love and trust you – can only change so fast. Circumstances may require you to move quickly, but just as quickly as possible you should re-establish a sense of the familiar and stable.
- Make sure the messages your people (and your customers, prospects and business partners) take home to their families are sober but positive and practical.
- Be serious but not worrisome or depressed in front of them.
- Get out in front of customers, prospects and business partners.
- Focus on getting to profitability now, and then on milestones to your 3-to-5-year goals.
Lastly, for you and for those around you, remember, family comes first, second and third in priority.
Appendix – Larger Versions of “Months of Safety” Spreadsheets
Figure 10 – Initial attempt by a real Solution Provider to create a risk-adjusted “Months of Cash #2” calculation.
Figure 11 - Revised risk-adjusted "Months of Safety #2" calculation with suggested assumptions.
Glossary of Terms
Term or
Abbreviation |
Definition |
Synonyms, More Information |
| Best-in-Class (or top quartile) |
|
When referring to EBITDA, this is the EBITDA % required to get into the top quartile of EBITDA% in the specified PBM, according to the Service Leadership Index®. When referring to other metrics, this is the average of the metric for those in the top quartile of EBITDA %. |
| DSO |
Days Sales Outstanding |
|
| EBITDA |
Earnings Before Interest, Taxes, Depreciation and Amortization |
The closest approximation to the amount of free cash flow produced by a company; that is, profit. Adjusted such that owner compensation for the role they perform in the company is paid at fair market compensation from the Income Statement, not the Balance Sheet, to produce the most accurate and comparable measure of profitability. |
| Adjusted EBITDA |
To best normalize for the effects of tax strategies, we adjust EBITDA to reflect fair market owner compensation coming from the income statement rather than the balance sheet. The amount of adjustment is based in PBM and Revenue size, and is known to our benchmarking subscribers. This adjustment is often used by those valuing companies, and it also lets the owner(s) in the company how much they would have in passive income from the company if they hired non-owner executives to do their jobs. |
|
| GM |
Gross Margin |
Revenue minus the cost to the Solution Provider of that which is being sold (Cost of Goods Sold or COGS). Explicitly does not include Sales, Marketing or General and Administrative costs. |
| Line of Business |
An over-arching practice as defined not by the technology being used or customer set being served but by the specific billable utilization pattern which must be optimized to produce the greatest profit at the highest service quality. |
|
| Median |
|
When referring to EBITDA, this is the Adjusted EBITDA % which separates those in the top half of EBITDA% attainment in the specified PBM™, from those in the bottom half. When referring to other metrics in the Service Leadership Index, this is the average of the metric for those who are not in the top or bottom quartiles of EBITDA%. |
| MSP |
Managed Services Provider |
A Solution Provider for whom Managed Services is the predominant Line of Business. Specifically, at least 40% of total Revenue comes from Services, and of those Services, Managed Services is the largest Revenue by at least 10%. |
| Normalized Solution Provider Chart of Accounts™ (NSPCoA™) |
|
The standardized categorization of Solution Provider Revenues and costs promulgated by Service Leadership to offer not just the optimal benchmark comparability, but more importantly also to provide Solution Provider management with the best transparency into the financial performance of their business. |
| Operational Maturity Level™ (OML™) |
Operational efficiency and effectiveness. |
The measurable degree of efficiency and effectiveness of the management and operational practices of a Solution Provider in their PBM, which correlates strongly to profitability, growth, scale and service quality. |
| Predominant Business Model™ (PBM™) |
That Line of Business which predominates the partner's Revenue mix. |
The PBM of the Solution Provider determines the drivers of its executives' decision making, the business model's capacity for profit and growth performance, and the specific Operational Maturity Level Traits (that is, best practices) which will be most effective in improving the business. For more information about PBMs, click here. |
| Applications - Project Services PBM, A-PS |
The Line of Business of developing and/or configuring and customizing commercial or custom applications. |
| Managed Services PBM, Infra-Managed Services, Infra-MS, I-MS |
A Solution Provider for whom Managed Services is the predominant Line of Business. |
| Product-Centric PBM, P-C |
A Solution Provider for whom resale of equipment, software and others' cloud services is the predominant Line of Business. |
| Professional (Project) Services PBM, Infra-Project Services, Infra-Projects, Infra-PS |
A Solution Provider for whom implementation of infrastructure is the predominant Line of Business. |
| Infrastructure - Shared Services PBM, Infra-Shared Services, I-SS, private cloud |
A Solution Provider for whom self-delivered cloud services is the predominant Line of Business. |
| Infrastructure - Technical Services PBM, Infra-TS T&M-Centric |
A Solution Provider for whom hourly-billed (break/fix) support is the predominant Line of Business. |
| Service Factory™ |
A euphemism for the process, tools and people who comprise the Pre-Sales Support and Service Delivery functions in the Solution Provider organization. Used to emphasize the programmatic or intentional way in which it can be best managed to produce high performance for all stakeholders. Can refer to a specific practice or location, or to the entire functional area within the company. |
|
| SG&A |
Sales, General and Administrative |
|
| SLA |
Service-Level Agreement |
|
| S-L Index™ |
Service Leadership Index® |
Quarterly financial and operational benchmark of Solution Providers worldwide conducted by Service Leadership, Inc. |
| S-L Index Annual Solution Provider Industry Profitability Report™ |
|
Contains a wealth of information about the financial health, viability and trends of Solution Providers within each specific business model in the industry. Click here to learn more. |
| SLIQ™ |
|
Service Leadership's proprietary Operational Maturity Level™ progression app for SP owner/executives. |
| SMB |
Small and Medium Business |
There is no precise definition but refers generally to end customer companies with under 100 users. A second useful qualifier for “SMB” is a customer who, after they sign the Managed Services agreement, has no more IT people on staff. This account can be managed using an “SMB” account management model. Any account, no matter what size, who after signing the Managed Services agreement, still has one or more remaining IT people, will not be successfully managed using an “SMB” account management model. |
| Solution Provider |
A company which provides IT services and solutions to end customers, sometimes also reselling products provided by vendors. |
Channel Partner, Partner, Dealer, etc. |
| T&M |
Time and Materials |
|