Value Creation Strategy Reboot
Revisiting and Recharging Your Value Creation Strategy
Table of Contents
What Is a Value Creation Strategy and Why Is It Important?
Business owners have material risk – there is no guarantee that a company will make money, or that it will survive and grow.
It's worth remembering that, as per the Service Leadership Index®, in any given period, one quarter of Solution Providers (i.e., the bottom quartile by profitability) lose money. Meaning, unless something changes, they are going out of business.
Meanwhile, one quarter (the top quartile by profitability) make about 19% or more at the bottom line if they’re Services-Centric, or 11% or more if they’re Product-Resale-Centric. More here.
Many private company owners have most or all of their personal net worth tied up in the company. As a result, they not only have business risk but personal risk.
They incur this high risk – and the daily workload, leadership and worry that running a business requires – not just because of the wage they hope the company can pay them, and not just because of the additional profit they hope the company can make (if any) but also because of the long-term value they hope to create.
Meaning, they hope to create a company they can someday sell – to their children, to their management team, to another Solution Provider or to outside investors.
They hope the amount they can sell it for, combined with what portion of profit (if any) they have been able to make and save along the way, can amount to enough to provide them with a safe and comfortable lifestyle when they are too old to work as hard.
When assessing the Operational Maturity Level™ (OML™) of a Solution Provider company, part of the way we determine what the company must do to have the best chance of realizing this future value, is assess what we call their Value Creation Strategy.
Of all the aspects of measuring operational maturity, Value Creation Strategy is the easiest to measure; it requires answering only three simple questions:
- Do you know how much stock value you want to create? (Yes or No)
- Do you know by when you want to have created it? (Yes or No)
- Do you know how you will extract it (i.e., how you will sell the company)? (Yes or No)
If you answered “Yes” to all three, you are at OML 5, the highest maturity in this aspect of the business. As it happens, companies that can answer “Yes” to all three of these, are most often those who do attain material value, and most often attain the value the owner has determined they need. As evidenced by their answers, these companies have a Value Creation Strategy.
If you answered “No” to all three questions, you are at OML 1, the lowest maturity. You have answered the same way as do the companies who most often fail to create material value for their owners. These companies do not have an actionable Value Creation Strategy. That said, they could have one; read on.
What Influences Solution Provider Value Creation?
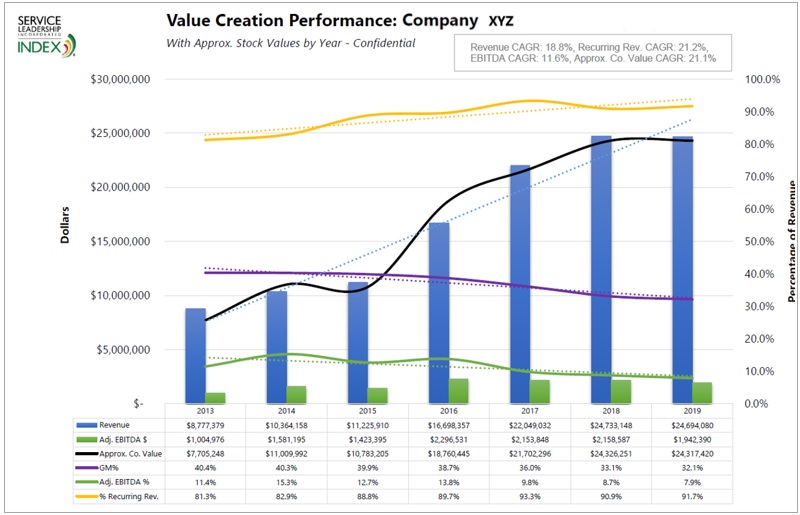
Early each year, we provide to the Solution Providers who benchmark via the Service Leadership Index®, a Value Creation Performance chart for their company. This chart is useful here in understanding some of the higher-level value drivers extant in Solution Provider companies. We’ll use a real (anonymous) example company in understanding if a Value Creation Strategy reboot is in order, and how it might best be done.
Here’s an example of one real (anonymized) Solution Provider from last year:
In this case, as you can see, the example company has been benchmarking with Service Leadership Index continuously since 2013.
The purpose of this chart is to provide company shareholders and executives with:
- A high-level view of their progress in creating shareholder value over as many as 10 of the most recent years,
- A visual understanding of the relationship between various aspects of financial performance and potential stock value.
A key reason they are working to improve their company’s performance is to accelerate and optimize the value it creates for their shareholders, regardless or when or how they choose to extract that value.
The Valuation Multiples Used Behind the Scenes
It’s important to note that the Revenue and EBITDA1 multiple used to calculate the approximate stock value are not visible on the chart. We update these multiples each year, just before we create and send out this chart. To help the Solution Provider management team focus on the value drivers, and on their track record, we don’t provide the multiples themselves, though they’re welcome to ask us for them.
It’s important to note, however, that multiples have been rising since the 2008-09 recession. Thus, a company whose financial performance has not changed since then, will show a large increase in value. The market is simply stronger for Solution Provider firms in general, and Managed Service Providers (MSPs) in particular; hence the rise in market value independent of financial performance.2
Limits of the Value Creation Performance Chart
The stock value shown is approximate: It’s based on Revenue and EBITDA multiples we believe were extant in the market in each of the years shown. However, this falls short of providing an actual valuation in many ways:
- The multiples used are our educated guess based on our visibility into the Solution Provider valuation and Mergers and Acquisitions (M&A) marketplace throughout the years; any given buyer or valuer may have different opinions,
- A more accurate valuation would also take into account a dozen or more additional factors not possible to incorporate into an accurate algorithm,
- There is no standard valuation methodology: Any given buyer or valuer might choose a completely different method of arriving at a value that they would find credible,
- Lastly, in any given M&A transaction, deal structure also influences value paid.
As a result, we advise that you take the approximate valuation shown in the chart, as a relative indicator of value improvement over time, and not as an indicator of actual company worth at any given point.
Components of the Value Creation Performance Chart
The chart is a good example of perspective on six vital performance dimensions:
- Revenue – The firm’s total top-line Revenue for up to 10 years ending 2020. Increases reflect rising OML in areas related to adding, retaining and growing customers, maintaining and raising prices, cross-selling new offerings, and so on.
- Adjusted EBITDA $ – Their bottom-line profit dollars after adjustment to normalize reported owner/operator compensation to fair market wages. We use this metric because it reflects the most accurate and comparable assessment of profit performance, and because it is a calculation most often used in valuing companies. Improvements are a result of rising OML in Strategy, Sales, Service, Finance and Compensation.
- Approx. Co. Value – This is a rough approximation of the stock value of the company based on Service Leadership’s assessment of the Revenue and EBITDA multiples effective in the U.S. marketplace (apologies to our non-U.S. clients; we’re not valuation experts in your markets) during each year shown.
- It uses the same methodology and multiples as the more powerful Solution Provider Valuation Creation Planner™ in SLIQ™, our OML progression app. More information here.
- There is no guarantee of stock value so this data should be used by the management team only for performance tracking purposes, not to inform or evaluate an actual transaction.
- They may never choose to sell the company; that isn’t the purpose of this line. It’s to provide a comparative measure of approximate value to inform shareholder decisions about value creation, not about value extraction.
- GM% - The Solution Provider’s blended (all Product and Services) Gross Margin percentage, which should rise over time to Best-in-Class levels unless they are increasing their mix of lower GM% (product) offerings. Shows progress in attaining higher OML in areas relating to conveying value and delivering Services efficiently.
- Adjusted EBITDA % - A measure of “altitude” or financial safety as well as ability to deliver value to customers and engage successfully in management by income statement. Improvement is a result of rising OML in all areas.
- % Recurring Revenue – This is the proportion of the Solution Provider’s Revenue that comes from their Managed Services or Shared Services (that is, private cloud from the Solution Provider’s own data center equipment)3. Because these Revenue streams have the highest stock value and, if properly profitable, provide the most safety due to their recurring nature, and if not, create the greatest risk. We include it in the chart for performance evaluation purposes. The Solution Provider’s Value Creation Strategy may or may not include increasing the proportion of recurring Revenue in their business; if not, this data should be flat.
The chart uses the data they input each quarter into our benchmarking system and reflects what has been reported in the Service Leadership Index Owner Quarterly Benchmark Report Book™ we send to this company each quarter.
Does the Company Need a Value Creation Reboot, and If So, What?
To help best understand this company’s Value Creation Performance, their situation and the steps they might take to reboot their value creation, let’s look again at the chart provided at the opening of this document.
What’s the Overall Value Creation Story?
First, this is a well-run company in many ways. Revenue growth and recurring Revenue growth are both well above average. EBITDA dollar growth is about average, but at 11.6% CAGR4 it’s not bad.
As a result, the Approximate Company Value CAGR is 21.1%, which is also above average.
Many would look at the proportion of recurring Revenue – over 90% in the most recent year – as a value enhancer, although for most MSPs a ratio of about 55% Managed and Private Cloud Services with the balance being product resale (including cloud resale) and professional (Project) Services, would be better. That’s because those non-recurring Revenue streams drive maximum Revenue generation per customer and optimum control of the account and the technology stack.
The Revenue growth rate from 2013 through 2018 – and especially starting in 2016 – is impressive. Questions would perhaps be:
- How much of this growth is one or two large or fast-growing customers? If the answer is, “None at all. This is growth from adding many average customers,” that would typically be a value enhancer.
- How much of this growth is due to acquisitions? If the answer is, “None at all. This is growth from adding many average customers,” that would typically be a value enhancer. That doesn’t mean displaying the ability to successfully close and leverage one or more acquisitions isn’t a value in and of itself, but sustained and increasing organic growth is typically more difficult and more critical to the company’s future.
As it happens, we know that in this company’s case, this growth was not due to acquisitions, but much – not all – was due to a few large customers growing their own businesses. So, while the organic growth rate is impressive, it primarily demonstrates an ability to win a few large clients and capitalize on them, not success at building a broader-based Marketing and Sales machine.
Likewise, the Adjusted EBITDA $ growth from 2013 to 2016 was impressive, but since then it hasn’t exceeded the 2016 level. And, because Revenue growth continued, the Adj. EBITDA % actually declined from above-median to below-median performance.
At the same time, Gross Margin % declined steadily, indicating a deteriorating profit model; growth in Cost of Goods Sold exceeded growth in Revenue. Whether this is a result of decreasing cost efficiencies or an increased proportion of unfavorable pricing, isn’t known, but the result is a downward trend in profit percent for three consecutive years following 2016. Adjusted EBITDA $ production fell by 15.5% over the same period.
Given these declines, why did the Approximate Company Valuation rise in 2018 and stay at that level in 2019? The answer is: marketplace multiples of Revenue and EBITDA continued to rise, offsetting the decline in performance.
How might a prospective buyer or investor look at the value of this company?
That depends on the Return on Investment (ROI) and “investment thesis” (how that ROI will be attained) of the buyer/investor. One buyer/investor might find this company to be a good vehicle for their goals and thesis, while another might find it uncompelling.
Reboot This Company’s Value Creation Strategy
Regardless, any buyer/investor (except one focused on investing as little as possible in a lower-performing company) would find more Adjusted EBITDA Dollars to be more compelling.
Likewise, the current shareholders would benefit from increased cash flow between now and the eventual sale of company, and at the time of sale in terms of increased company value.
To optimize these tactical and strategic outcomes for the current shareholders, our recommendation for this company would be to fix the profit model, then grow.
That doesn’t mean literally stop growing, but at this time, invest efforts in driving higher and higher Adj. EBITDA % rather than accelerated growth. Based on the company’s persistent downward trend in margin evidenced in the chart, more growth on top of the current profit model would drive the company value down, and eventually, out of business.
Yes, ideally more Revenue on the existing model would improve profitability, but with the pattern evidenced here, most often, more Revenue equates to further declining profit margins and often to declining profit dollars. Something is wrong with their profit model, which needs to be addressed before Revenue growth is safe and productive.
To put this in perspective, if the company at its current size, returned to its previous high of 13.8% Adjusted EBITDA (bearing in mind that’s above Median but still well below Best-in-Class for the business model):
- The company’s valuation would be higher by perhaps 30% to 40%, and
- In the meantime, it would be throwing off nearly double the cash to its current shareholders.
Fixing the profit model would result in a more compelling company to current shareholders and future ones as well. A rebooted Value Creation Strategy is merited tactically and strategically.